I am following along with the latest video for Segmentation Patterns from the Enterprise DNA Learning Summit, August 2018 and have some issues getting the customer groups to work properly.
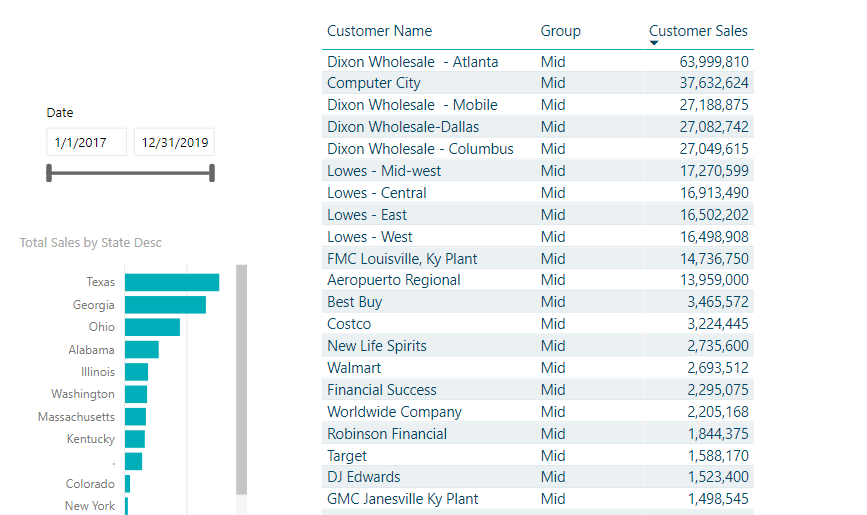
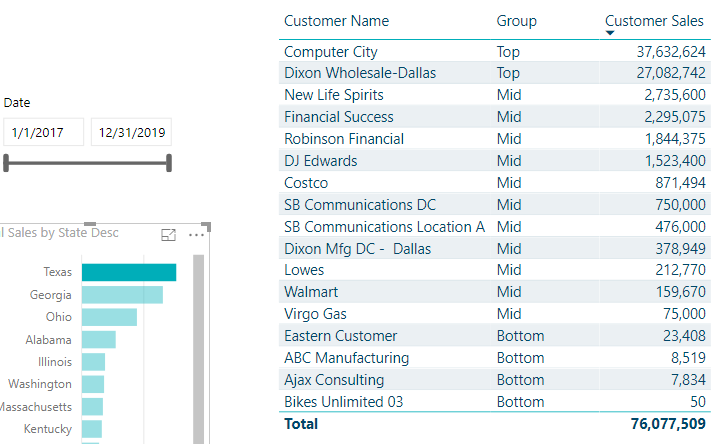
I was able to get the Customer Rank to work as you showed. It also seems like the Customer Sales measure is working properly too. The issue arises when I try to add the Customer Group field to a table with the Customer Name and Customer Sales as shown in the Segmentation Patterns video. When there are no filters applied to the table (other than the row context filter for each customer name), only the Mid and Bottom groups are displayed and it seems non of the customers get placed in the Top group. However, when you select a dimension such as State in another visual on the page, the table is filtered to just customers in that State and the table visual then updates per the selection and the customer groups including the Top group is populated as designed. How is changing the filter context of the page able to populate the Top Customer group? What am I missing here?
Here is the PBIX for the above question.
Sales Analytics - v4.pbix (2.6 MB)
Will have a look at the model on this one and try to replicate
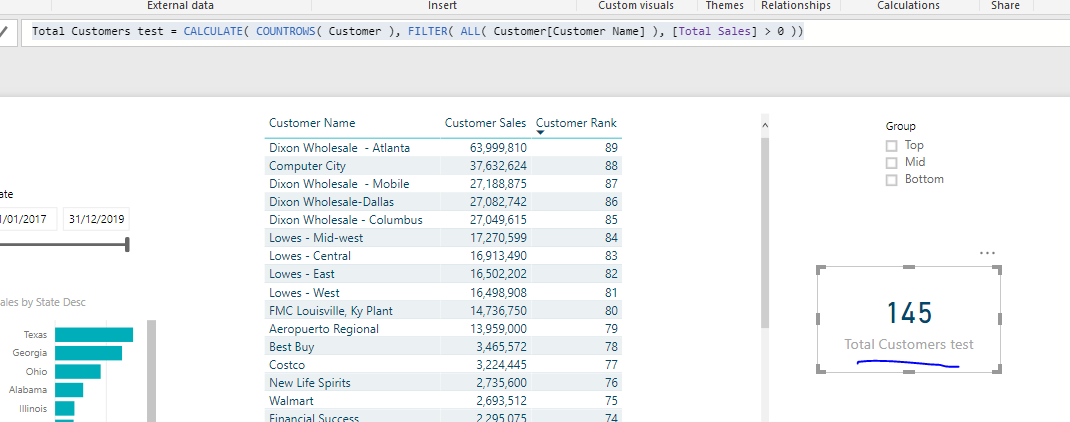
This is the part which has the issue
Total Customers test = CALCULATE( COUNTROWS( Customer ), FILTER( ALL( Customer[Customer Name] ), [Total Sales] > 0 ))
I could quickly see by breaking it out.
That’s why no one appears in the TOP because it looks like there is less actual customers with sales than 145
So now I need to work out why it’s this result.
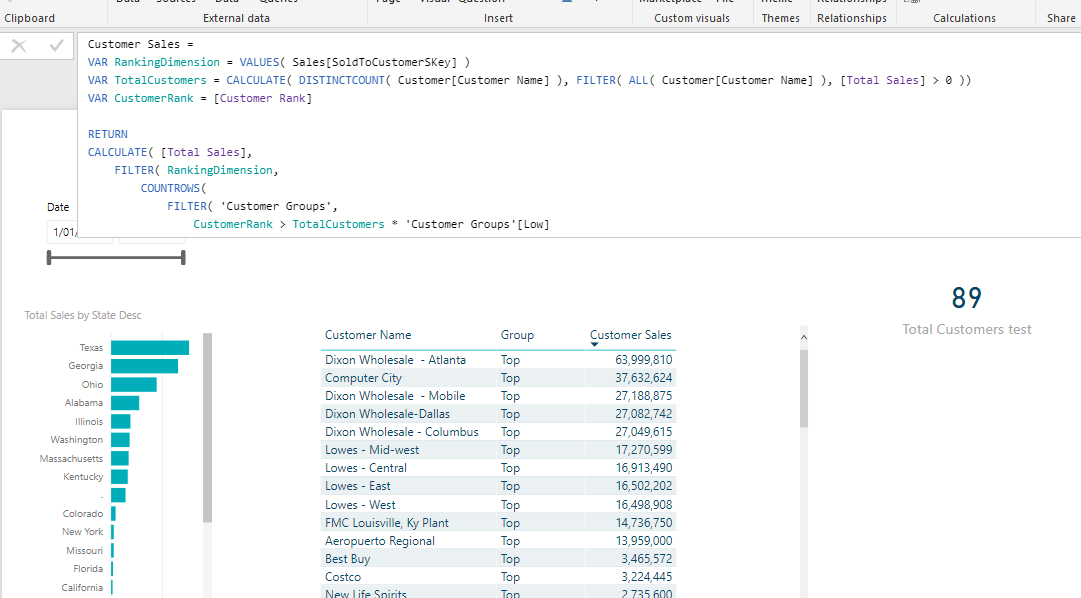
I tested a couple of things then realised this is what you need. Using DISTINCTCOUNT instead of COUNTROWS
Customer Sales =
VAR RankingDimension = VALUES( Sales[SoldToCustomerSKey] )
VAR TotalCustomers = CALCULATE( DISTINCTCOUNT( Customer[Customer Name] ), FILTER( ALL( Customer[Customer Name] ), [Total Sales] > 0 ))
VAR CustomerRank = [Customer Rank]

RETURN
CALCULATE( [Total Sales],
    FILTER( RankingDimension,
        COUNTROWS(
            FILTER( 'Customer Groups',
                CustomerRank > TotalCustomers * 'Customer Groups'[Low]
                && CustomerRank <= TotalCustomers * 'Customer Groups'[High] ) ) > 0 ) )
I’ve reviewed the existing demo file and it is correct, there is actually one small difference to your data and that is why it didn’t work exactly for you.
In your customer table it looks like the customer name can be listed more than once. And countrows was doubling (or tripling) certain customers with the COUNTROWS.
In the demo file that isn’t the case so I was comfortable using COUNTROWS.
DISTINCTCOUNT is fine in this case though.
Chrs
That definitely fixed things, thank you, nice pick up there. Our demo data-set is not the best quality so it can make developing a bit tricky. I have to imagine that many data-sets have repeated Customer Names since most systems are storing a Customer Key field as the Primary Key and not the Customer Name, correct?
Are there any caveats of using DistinctCount over Countrows in this segmentation pattern?
No real caveats. They serve their purpose depending on the scenario.
You really want you customer table to be unique. One customer per row.
Maybe some clean up required in the data set with the query editor?
One other option is to break out a unique customer list into a new table, and have this as your primary lookup table for customers.
I go over this type of technique here.
You can also do this in the query editor as well if you want.
See how you go with these ideas.