Good day,
I’m using the example from the Understanding Your Customers Better w/Power BI & DAX video and am encountering an issue I haven’t seen addressed in the forum.
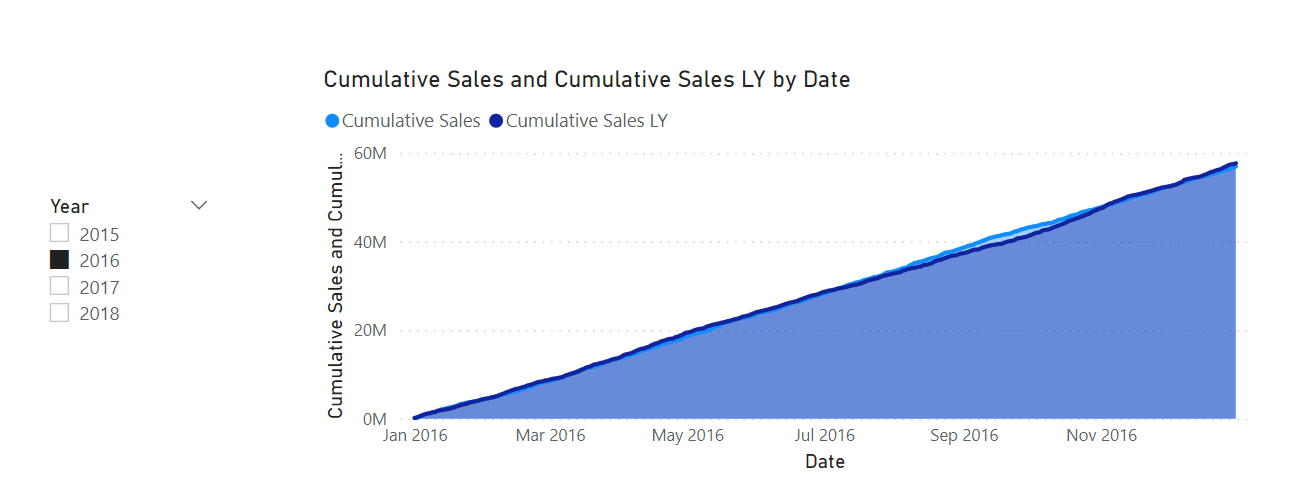
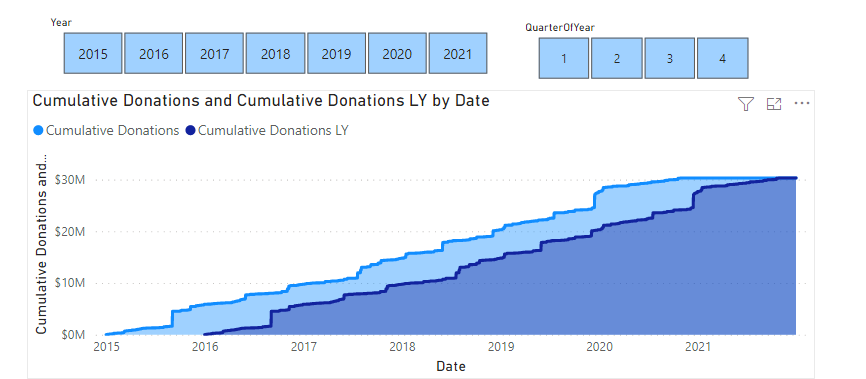
When using the Cumulative Sales pattern, it works for when I have all years in my dataset selected, but if I use the Year slicer, rather than start at zero for that year and show the cumulative total only for that year, it starts with the total since the beginning.
This is what I see when all years are selected:
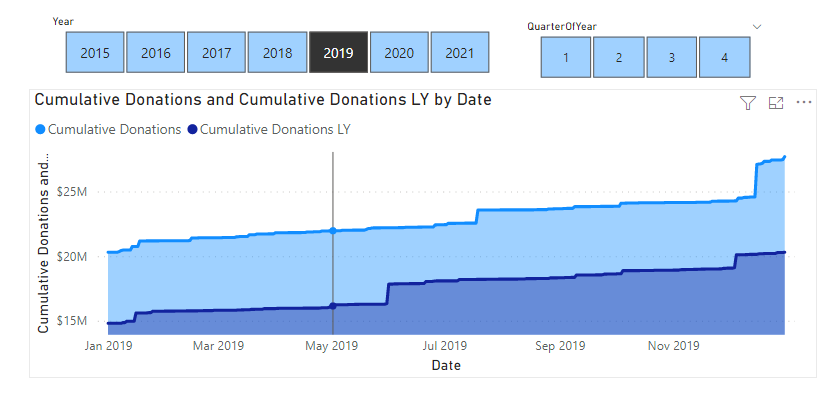
But when I select a single year, e.g. 2019, instead of seeing the graph start from zero in January as in the video, it picks up from December of 2018:
The dataset is very simple, just a list of Donors, a table of Donations, and a Date table.
My formulas for the different measures are:
Total Donations = SUM(Donations[Tax-Deductible Amount])
Donations LY =
CALCULATE([Total Donations],
SAMEPERIODLASTYEAR(Dates[Date]))
Cumulative Donations =
CALCULATE( [Total Donations],
    FILTER(ALLSELECTED(Dates[Date]),
    Dates[Date] <= MAX(Dates[Date])))
Cumulative Donations LY =
CALCULATE( [Donations LY],
    FILTER(ALLSELECTED(Dates[Date]),
    Dates[Date] <= MAX(Dates[Date])))
I’ve reviewed the video a few times and don’t see any issue. Normally I would use DATESYTD but I like the idea of being able to have the cumulative total over varying selected time ranges.
Any assistance would be greatly appreciated.
Thanks!
George