Customer attrition DAX calculation

Hi,

I am struggling to understand the DAX calculation for the number of new sales made for a time period.

I have tried to do a ‘dry run of the expression’ in here so you can understand my interpretation of the measure. Any pointers on where I am misunderstanding the DAX is hugely appreciated.

I have also uploaded the sample pbix file.

The measure I am using is the same one given in the customer attrition course.

New Customer Sales =
VAR Customer = VALUES(Sales[Customer ID])
Return
COUNTROWS(
FILTER(Customer,
CALCULATE( COUNTROWS(Sales) ,
FILTER(ALLSELECTED(Dates), Dates[Date] < MIN(Dates[Date]) ) ) = 0 ) )
Customer retention DAX calculation.pbix (739.7 KB)

Hi,

I take a different approach to solve your above problem .

New Customer Sales =
VAR Customer = VALUES(Sales[Customer ID])
Var dt= MAX(Dates[Date])
Var tb1=SUMMARIZE(FILTER(ALL(Sales),Sales[Purchase Date]<dt),Sales[Customer ID])

Var un=INTERSECT(Customer,tb1)
Var new=FILTER(Customer,NOT(Sales[Customer ID]) in un)
Return
if(ISBLANK(COUNTROWS(new)),0,COUNTROWS(new))

Attaching pbix for your refrence:
Customer retention DAX calculation.pbix (740.1 KB)

Let me know if this solve your problem or you req something else.

Thanks very much for the reply. However, I am more interested in understanding the solution that I have posted ( it is the same solution presented by Sam).

Hi,

Can you share the video link here so i can go and from best of my knowledge try to simplify for you.

Thanks,
Anurag

1 Like

That would be super helpful. The video can be found at https://portal.enterprisedna.co/courses/236946/lectures/3936501

Check out this video here to see an updated formula strategy for this

Check out this webinar as well

Chrs
Sam

2 Likes

@Azee , Seems that you are very interested to know how does your the oritinal DAX query really worked , Rather then finding solution for the problem to say; Even I am learning and exloring the DAX world and I am sharing my learning in the process for your and other feedback too

So Lets focus on what your ask is -That is your desire to understand the initial DAX query you mentioned .

Let me try to distill down a bit , The approach I am going to use is old Step by Step break down observe and then see it through again

–This is your original query
New Customer Sales (Final Step) =

Analysis Step 1: Verify what does customer visible filter context contains

VAR Customer = VALUES(Sales[Customer ID])
Return
COUNTROWS(
FILTER(Customer,
CALCULATE( COUNTROWS(Sales) ,
Analysis Step 2 -Verify what Does Date Filter context return for calculate to work on

       FILTER(ALLSELECTED(Dates), Dates[Date] < MIN(Dates[Date])  )  ) = 0 ) )

Notice Step 1 and Step 2 comments . .

First we will see What does the Filter with All selected returns

Then we are going to see what does Visible filter context for customer number contains

Step 1 measure

New Customer Sales(Analysis Step 1) =
VAR Customer =
VALUES ( Sales[Customer ID] )
RETURN
CALCULATE (
CONCATENATEX ( VALUES ( ‘Sales’[Customer ID] ), Sales[Customer ID], ", " )
)

Step 2 measure

New Customer Sales(Analysis step 2) =
VAR Customer =
VALUES ( Sales[Customer ID] )
RETURN

        CALCULATE (
            CONCATENATEX ( VALUES ( 'Dates'[Date] ), Dates[Date], ", " ),
            FILTER ( ALLSELECTED ( Dates ), Dates[Date] < MIN ( Dates[Date] ) )
        ) 

–lets start debugging step by step by picking some of the dates and pull in our debug measures as below

Please read through the anotation and try to analyze thus far if you get some more visibility . .

So what really we are doing is .

  1. For the Selected Dates (Allselected ensures it ; if we don’t select anything ; we are essentially going through one by one each of the dates . .

Now lets say you don’t have the date column at all , Then we don’t have any reference of date , So it will display count of all the customers . . .you can try it out

Let’s move on . .

  1. If you observe the 2nd column in the screenshot (Via step1 analysis meausre ) -Really we are Filtering at date level (not iterating ) -what are the visible Customers

So for the 1st row . we have 12 customers

To reiterate VALUES ( Sales[Customer ID] ) returns the customers in the current visible filter context -in this case filter context contains only the date from the table column (first)

  1. The Date filter with all selected is really acting as a Calculate Context modifier with reference to the date in current filter context (that is actual filter context

So to say : FILTER ( ALLSELECTED ( Dates ), Dates[Date] < MIN ( Dates[Date] ) ) within the actual complete DAX query . .

Returns All dates < current filter context date .

You can clearly visualize this fact from 3rd column and also the annotation -crisply . .

  1. Now move your attention to the marking for some customer number c1335 and c1004 which are repeated across some dates . .

  2. if you observe the last column -All the customer number which earlier had sales were substracted from the total count (see the annotation )

So to summarize really what this formula is doing is

Iterating through customers in current visible filter context and counting no of customers which didn’t had any sales in any of the previous selected dates . .which indirectly signify that they are new customers.

Please let me know if it helps . .
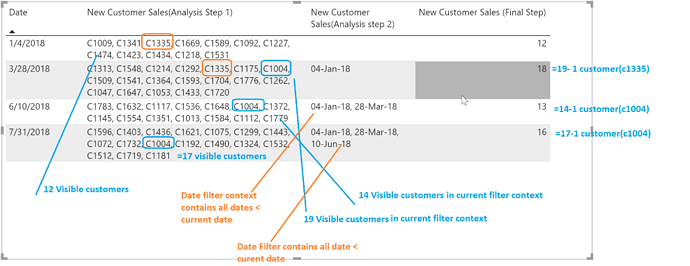
3 Likes

Welcome to the forum @Azee. :slight_smile:

Good to see that you are having progress with your inquiry. Kindly take time to answer the Enterprise DNA Forum User Experience Survey, we hope you’ll give your insights on how we can further improve the Support forum.

In addition, we just want to ask if the responses abovehelp you solve your inquiry?

If not, how far did you get and what kind of help you need further? If yes, kindly mark as solution the answer that solved your query.

Thank you so much for that detailed explanation! That really cleared my understanding.
If there are any articles/ videos that can help me understand how a complex DAX measure is being executed, please do let me know.

2 Likes

Incredible support. Well done

@Dhrubojit_Goswami ,

Fabulous breakdown and explanation of a complex pattern. Thank you for taking the time to share your learning.

  • Brian

Thank you @BrianJ Thank you So much for your feedback

Hello Dhrubojit and Forum:

I really enjoyed reading through the posts and have a bit of dilemma applying the various methods to a very practical file. I have attached a PBIX in which I’m trying to understand which methode is best to use for ascertaining new/lost customers. I am getting different results or no results depending on whose measure I apply.

I have a simple grid showing an additional customer for each successive month and mid-way through I subtract a customer per month (generally). I was hoping because the grid is so straightforward the results would be the same.

If you/anyone has the time to suggest which measure to use get new and lost customers for this example it would be great.
New-Lost Experiment.pbix (88.8 KB)

The first page is the summary grid and the next two pages uses both a monthly time frame and then a daily timeframe in which to analyze from.

Any input is sincerely appreciated.

Thanks!

Bill