First, I don’t see the “Data Visualizations” board anymore so I am not certain where to post this…
I am trying to display sales data by zip code only using a shape map instead of a regular map that shows the bubbles. I have downloaded a Census zip code map and run it through MapShaper to reduce the size of the file and it will display on my map, however I can’t figure out how to join my fact table with sales by zip code to this custom map. I don’t actually see zip code in the custom map. any suggestions? Are there any examples of this type of map on EDNA?
Thanks!
Hi @patrickcox
More about shape map you can find at:
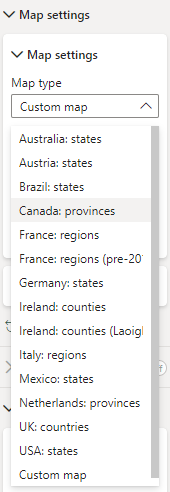
you need to pick Custom map:
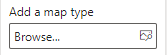
and add file:
and then add Location and Color saturation
for more precise help could you provide some sample pbix file ?
Best regards,
Maja
Thanks for your reply. I actually used that page to get to where I am. I have attached an example PBIX file. It has sales transactions with Zip code data. And then I have created a shape map visual and added a customer zip code JSON file I created from a census file. The first tab contains the shape map with the custom map JSON file. It is extremely slow. But it also isn’t really working. I think the problem is that I have no relationship between the custom map and the Sales data by Zip Code. That is where I need help.
Thanks!
AdventureWorks_Map Example.pbix (2.3 MB)
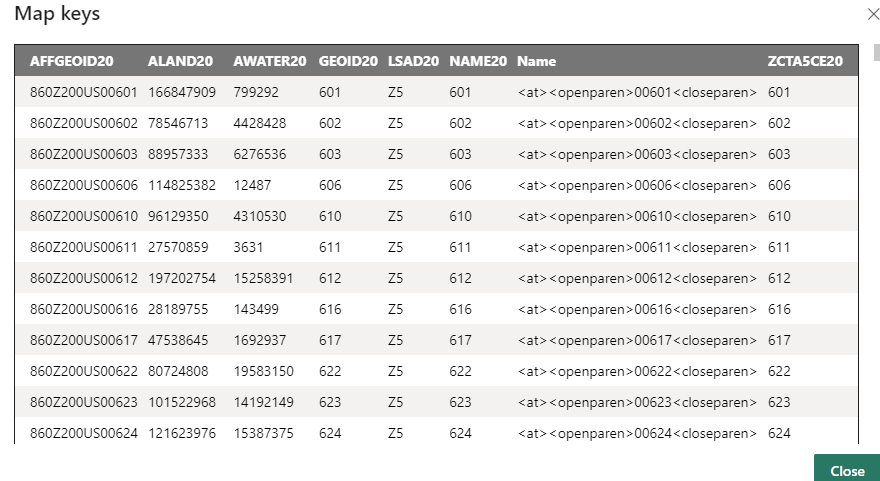
Could you check your CustomShapeMap cb_202us…
When I check custom shape map
under View map type key
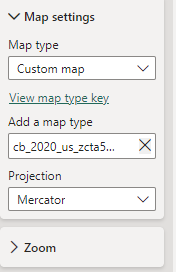
I don’t see 5 digits postal codes:
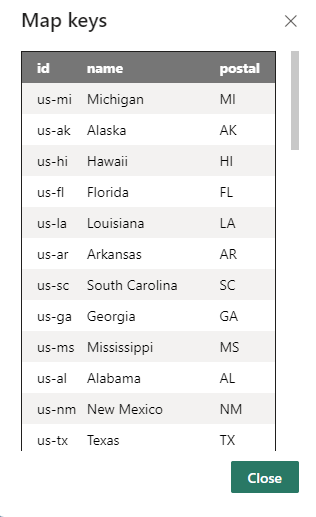
For example if you go to the standard that you use you have Province name
I started with the following file from the census bureau and then converted it to JSON…
CensusZipCodeTabulationAreas
I think the last column is actually the zip code but it was converted to a number format so leading zeros were dropped. I actually just tried a different source for the zip code list and just used one state and I think i have it working.
For reference, I used this source, which seems to be a better source…
SimpleCrew
Thanks for your help.
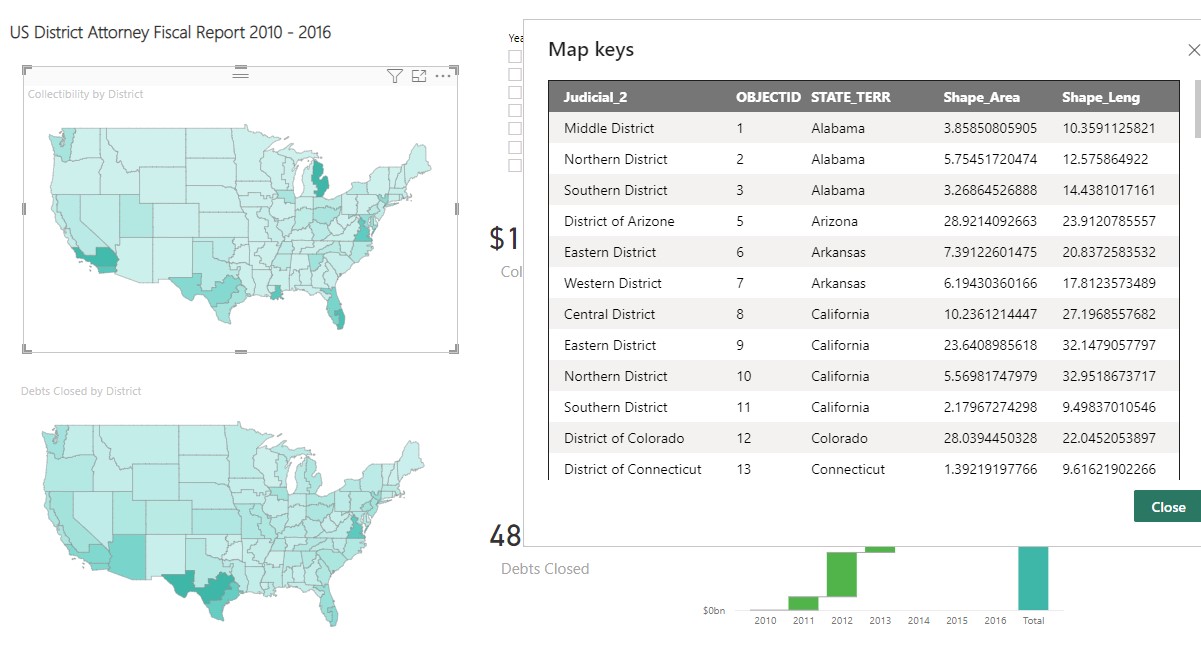
Does anyone know how these districts are created in this PBI example from Microsoft? (The Shape_Area and the Shape_Leng). Thanks.
Bumping this post for more visibility from our experts and users.
Hi @patrickcox
We noticed that your inquiry was left unsolved for quite some time now.
Looks like your inquiry was out of the experts’ and users’ bounds.
If you were sure you provided all pertinent context to your concerns and read how to use the forum more effectively and still find your question unanswered, your membership also comes with relevant resources that may help you with your Power BI education, so we advise that you check these resources as well.
While our users and experts do as much as reasonable to help you with your inquiries, not all concerns can be attended to especially if there are some learnings to be done. Thank you!
In light of this, we will be closing this thread, but we invite you to start a new thread with updated details so that our experts can better assist you.
Thank you for being a part of our community, and we hope you find the help you need.