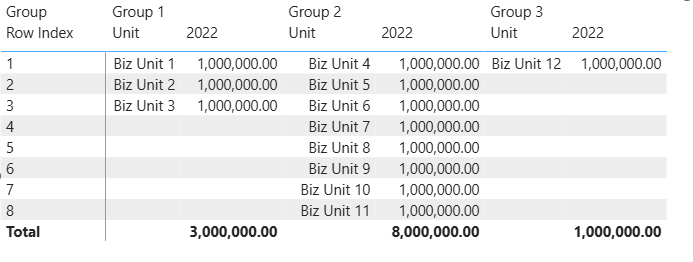
I am trying to create a matrix whereby the rows (business unit) under each column (group) appear for only that specific column. My table is flat with a column for business unit, group, year and amount. A standard matrix has all the row headers to the left with blank values under the groups for which they don’t pertain. I don’t want to have to create three individual matrices but am hoping to accomplish this in one. Is this possible?

Hi @Craig S,
Thank you for reaching out to the community.
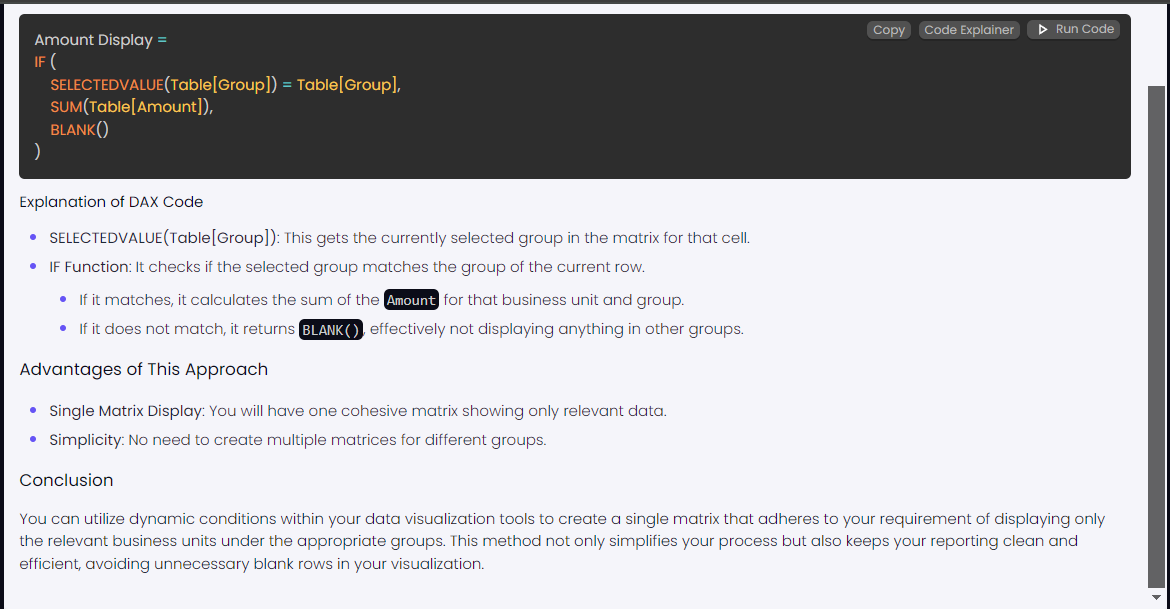
While we wait for other members to share their insights, we’ve taken the liberty of using “Explain Simply ,” one of the tools available within Data Mentor (you can explore it here: https://mentor.enterprisedna.co/explain-simply . It generated the following results:.

Cheers,
Enterprise DNA Support Team
well, this would not be my personal go-to, but there IS a way to ‘sort of’ accomplish what you’re looking for.
It involves creating a mapping table of your column names - and then modifying your sum total to add values based on the mapping table output.
Important note this is not ideal for variable data, adding years will require updating your map table.
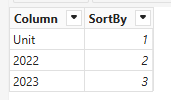
So, here is my column Map table:
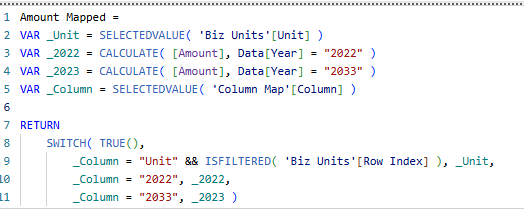
returning the table output requires a special measure - one that returns data based on the Map table:
it might be possible to create something custom with Deneb or Charticulator - I’m not entirely sure.
attached is my sample:
Test Matrix.pbix (31.0 KB)