Hello EDNA Forum
I’m need to create a custom grouping re: the following:
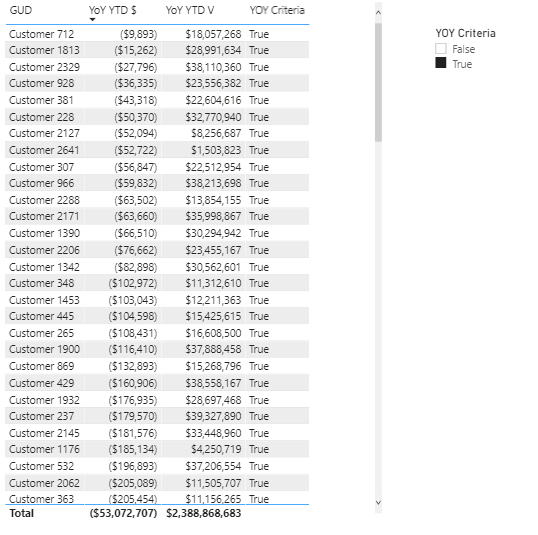
YoY YTD V - is a positive number and the YoY $ is a negative number. I only want to see a list of those customers that fall into this specific criteria. Would like the results in a table form
What is the best way to approach this ?
Attachment:Randon Numbers V and R_ Usage Data by Randon GUD Name 01 04 21.xlsx (95.9 KB)
You could definitely do this in DAX as well, but I think sticking with the general guideline that “if it can be done In Power Query, it probably should be”, that’s the solution I’ve implemented here.
Just a small bit of custom M with a nested IF statement:

From this, you can slice your table (as I’ve done below) or filter it in the filter pane on YOY Criteria = TRUE.
I hope this is helpful. Full solution file attached.
- Brian
eDNA Forum - YOY Nested IF Criteria Solution.pbix (129.3 KB)
Note: I’ve set the file location as a parameter in PQ, so to use my solution on your computer just point the FileLocation parameter to your Excel data file.
Hi @ambidextrousmentally, provided by @BrianJ help you solve your query? If not, how far did you get and what kind of help you need further? If yes, kindly mark the thread as solved. Thanks!
Hi @ambidextrousmentally, we’ve noticed that no response has been received from you since the 5th of January. We just want to check if you still need further help with this post? In case there won’t be any activity on it in the next few days, we’ll be tagging this post as Solved. If you have a follow question or concern related to this topic, please remove the Solution tag first by clicking the three dots beside Reply and then untick the checkbox. Thanks!
A response on this post has been tagged as “Solution”. If you have a follow question or concern related to this topic, please remove the Solution tag first by clicking the three dots beside Reply and then untick the check box. Thanks!