I am trying to create a visualization that shows current asset allocation and the delta from the target allocation. The measures don’t work appropriately when I use the lookup tables to create filter context. For example, creating a matrix using Asset Name from the security lookup table and total market value measure returns a sum total without listing any of the asset names.
I ultimately want to show what the portfolio of securities needs to do (buy or sell) in order to arrive at the target allocation referenced by the allocation target table. I’d like to be able to filter this in multiple ways. By Account, Class, Segment, Asset or a combination of each. I think part of the complication arrives because the securities in the target allocation may not exist the current allocation.
As a note, the short term target allocation is interchangeable and all values are currently 0%. The long term target allocation is a static figure.
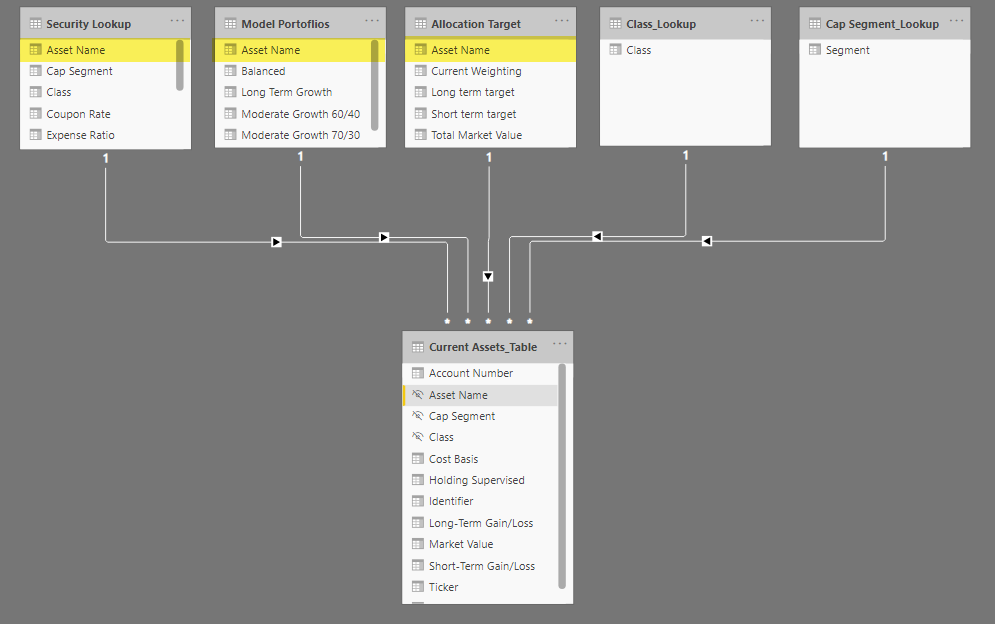
I have some concerns about your model, you have set up 3 dimension tables all linked to your fact table on the same key. Filtering only flows down stream. A filter from one of these 3 tables will filter your fact table but not the other dimension tables on top.
I’m not familiar with this type of dataset but looking at the contents of each of the table I suspect Security Lookup is the dimension table and both Allocation Target and Model Portoflios should be disconnect and referenced using TREATAS.
At the moment your reporting canvas is completely blank. It would be helpful and greatly appreciated if you can provide a mock up of the scenario’s, type of visualizations and also the desired/expected results.
Hi @jsailar, we aim to consistently improve the topics being posted on the forum to help you in getting a strong solution faster. While waiting for a response, here are some tips so you can get the most out of the forum and other Enterprise DNA resources.
Use the forum search to discover if your query has been asked before by another member.
When posting a topic with formula make sure that it is correctly formatted to preformated text </>.
Use the proper category that best describes your topic
Provide as much context to a question as possible.
Include demo pbix file, images of the entire scenario you are dealing with, screenshot of the data model, details of how you want to visualize a result, and any other supporting links and details.
I have updated the file to include a visualization. You’ll see that the long term target weighting is not reporting correctly. I agree that it is because of the data model. I guess I don’t fully understand why a the same relationship key would not produce the desired result.
Also, I don’t know that it is entirely necessary for me to have the Security lookup table? I could just use the Current Assets Table and the Target Allocation tables as my lookups.
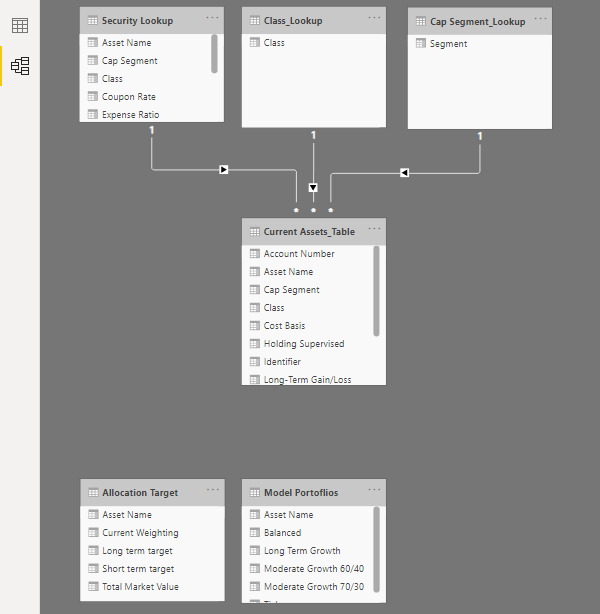
Cross filters only flow down stream, they cannot move against the set filter direction. Each dimension table should have it’s own unique Key to the fact table. So there is no ambiguity in filtering, like you’ve experienced.
Note that without changing your model, this will get you the same result but I would not recommend it because this issue in the Model can cause other problems down the line as well…
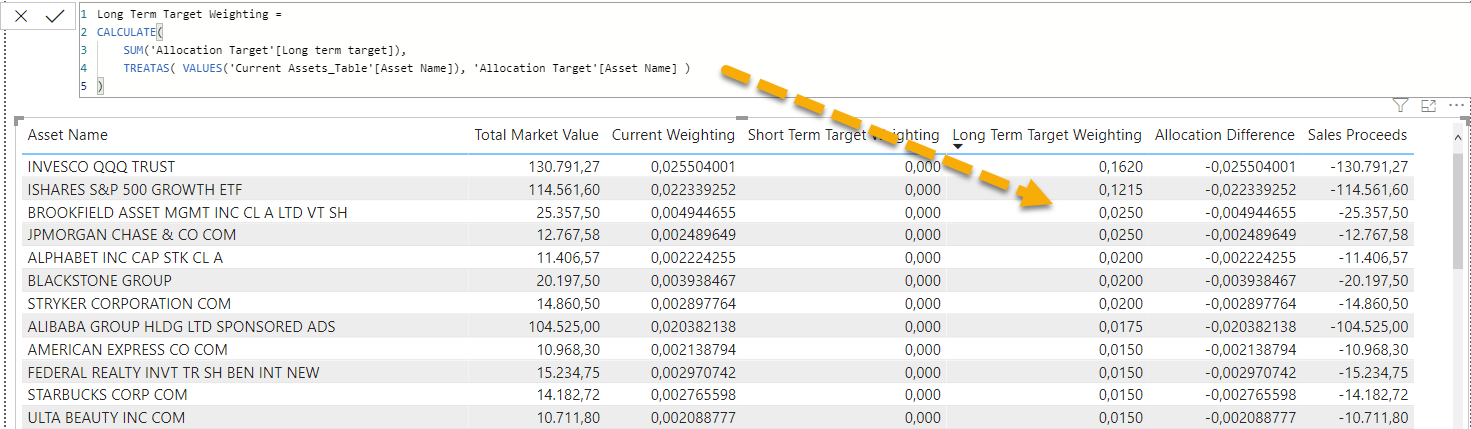
Long Term Target Weighting =
CALCULATE(
    SUM('Allocation Target'[Long term target]),
    CROSSFILTER( 'Allocation Target'[Asset Name], 'Current Assets_Table'[Asset Name], Both )
)
This is super helpful thank you. After thinking more about your method, I think I may have not asked the right question because I wasn’t thinking far enough ahead. TREATAS allows me to take assets that we own from the Current Assets Table and run them through the target allocation measure. This is effectively what I wanted to do except, it doesn’t return assets that the client should own (Model Portfolios) but doesn’t yet.
So I think what would be more effective is, to remove the Target Allocation table altogether and find a way to compare and combine the Current Assets Table (everything client owns) to the Model Portfolio (everything the client should own and in what amount % based on the desired model). The visualization should return the difference between the current asset allocation and the target asset allocation. I believe that this could be done by merging the two asset name columns into a virtual table and applying the current market value measure, current weighting measure and the rework the target allocation measure to filter through the Model Portfolio Table instead? For Any position that is owned and should not be owned (per the Model Portfolio Table) the measure should return 0%. That way the use knows how much needs to be sold.
The next step is to allow the use to apply a target allocation via the Model Portfolio Table to the current asset allocation with a slicer so they can review the various model portfolios against their current holdings. This is why I am suggesting that the Allocation Target Table is potentially useless.
I apologize this is a departure from the previous solution but if we can consider that detail ( combining what is owned and what should be owned into a table) this is very workable. I hope I am thinking about this the right way!
Hi @jsailar , did the response provided by @Melissa help you solve your query? If not, how far did you get and what kind of help you need further? If yes, kindly mark the thread as solved. Thanks!
That is an entirely different matter, therefor I would like to suggest that you mark the answer to your original question in this thread as solved and start a new one.
To give you an idea - it’s not hard to identify assets missing: