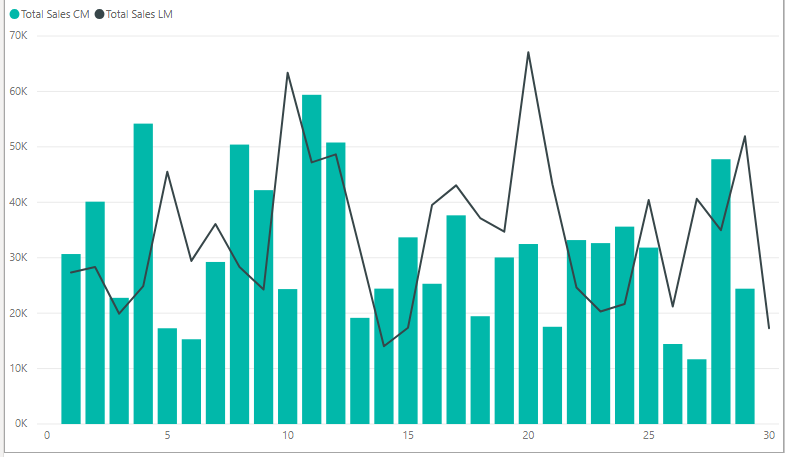
Would require your help to crack the below scenario, wherein i need to compare current month vs previous month value in bar and line chart having axis as day. The image is attached.
Now when i am in January of every month Ispreviousmonth , calculation fails.
Kindly request you to help me with the above use case.
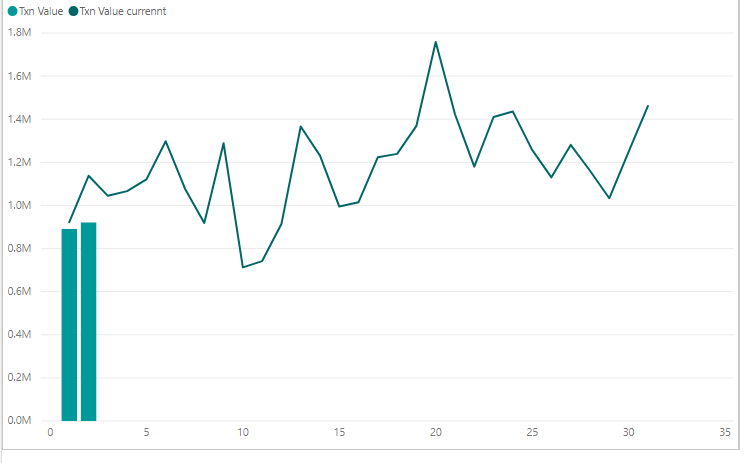
For Jan month I am expecting the visual to look like Pic 2.
I am open for suggestions wherein rather than calculated column i can handle current month and previous month in measure itself for the above use case.
The DATEADD function makes quick work of this problem. In addition to your Total Sales measure, all you need is a previous month’s sales measure using DATEADD to step the calculation back by one month:
Thanks for the quick response, but in the case specified below, I do not want to make a MonthinCalendar selection.
On daily basis when the Power BI gets refreshed with new data set , it should by default always have the visuals been updated for only current month and line with previous month information.
I dont want to update the slicer selection each month manually.
Because in the pbix shared by you , if i remove the month slicer selection , it would show me all the data.
I did use the below calculated column for previous month =
IspreviousMonth = IF(Dates[MonthInCalendar] = FORMAT(DATE(YEAR(MAX(Dates[Date])),MONTH(MAX(Dates[Date]))-1 ,DAY(MAX(Dates[Date]))),“MMM YYYY”),1,0)
and for current month something which i have specified in my earlier post and now I get the Output as required.
It would be great if you have anything other than calculated column method.
Not a problem – we just need to modify both measures to add a bit more time intelligence.
For the current month measure, it now calculates the first day and last day of the current month, and filters the total sales calculation for the dates within that range:
Similar approach for the previous month measure, but in this case we calculate the date range in a one column virtual table and then run the DATEADD function against that table for evaluation context:
Sales PM to CM =

VAR CurrentMonth = MONTH( TODAY() )
VAR CurrentYear = YEAR( TODAY() )
VAR LastDay = EOMONTH( TODAY(), 0 )
VAR FirstDay = DATE( CurrentYear, CurrentMonth, 1 )

VAR ContextTable =
CALCULATETABLE(
    VALUES(Dates[Date]),
    Filter(
        Dates,
        Dates[Date] >= FirstDay &&
        Dates[Date] <= LastDay
    )
)

RETURN
CALCULATE(
   [Total Sales],
    DATEADD(
        ContextTable,
        -1,
        MONTH
    )
)
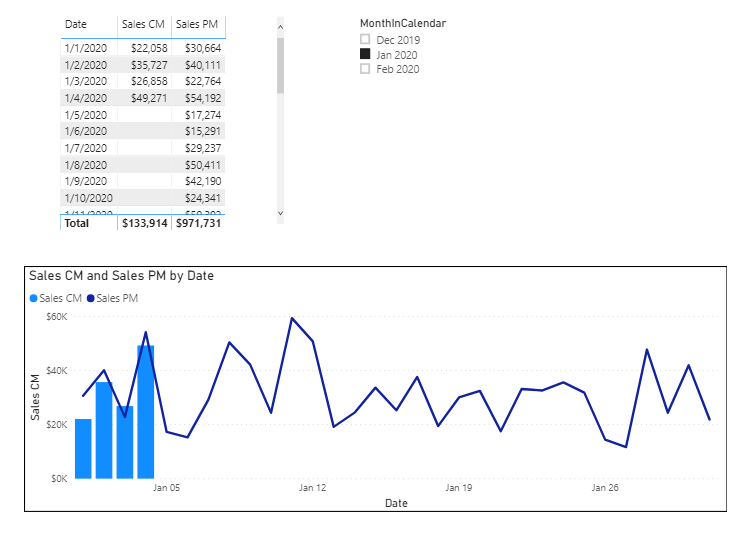
And here it is put together, this time with no slicer:
P.S. Alternatively, you can handle the bulk of the time intelligence work in Power Query. @Melissa has a cool calendar offset method she uses for this sort of problem:
@BrianJ -
Sorry to bug you but , i want to add one more criteria to this scenario, i.e as we have used today as the function which identifies current date and calculates the related metrics. So now what if , my data for today is always of previous day . Would the DAX calculation specified above handle this.
So what i mean on 10/01/2020. The dataset gets refreshed and it holds the data of 09/01/2020.
Would this cause an issue in the real time scenario when my system date changes post 12:00 am and report would display blank for 10/01/2020.
I mean on 1st Jan the report should show current month to be December and PM value as November. On 2nd Jan it will display 1st Jan as CM and December as Previous Month. With Today() function being included would that help.
In My case of calculated column what i have done is that while getting the date table from database applied a condition , so that my date table fetches all the dates < today - " where CalendarYearMonth >= 201906
and [FullDate2] < cast(getdate() as date)"
And then created the calculated columns based on the Max date in the date table and the calculation are specified in my previous post. This is done to handle the scenario specified above. So with Today() function used in ur measure how would you handle this.
Thanks alot for the quick response. Now in the M- code we have used localNow. Which gives today’s date itself. But my requirement is if my last refresh is today the data present is of previous date i.e. date in the transaction table is 09/01/2020 , it should show the data till 09/01/2020.
now i am in the date 1st Jan and the report refreshes , around 12 pm noon of 1st Jan 2020, now in the graph of my requirement the current month would still be dec and previous month be November. With the refresh date table when my model would get refreshed it will display 1st jan as the date and it would go into the measure as 1st Jan itself which is similar to having today() function in the measure.
I hope i am getting the code provided by you right!! but in my scenario i consider it would not help.
Ok didn’t get that sorry. You can use the literal #duration to offset a certain number of seconds, minutes, hours or days, below I subtracted one day from the DateTime.LocalNow()
let
  Source = DateTime.LocalNow() - #duration(1,0,0,0),
  #"Converted to Table" = #table(1, {{Source}}),
  #"Renamed Columns" = Table.RenameColumns(#"Converted to Table", {{"Column1", "Last Refresh"}}),
  #"Changed Type" = Table.TransformColumnTypes(#"Renamed Columns", {{"Last Refresh", type datetime}}),
  #"Inserted Date" = Table.AddColumn(#"Changed Type", "Date", each DateTime.Date([Last Refresh]), type date),
  #"Insert Time" = Table.AddColumn(#"Inserted Date", "Time", each DateTime.Time([Last Refresh]), type time)
in
  #"Insert Time"