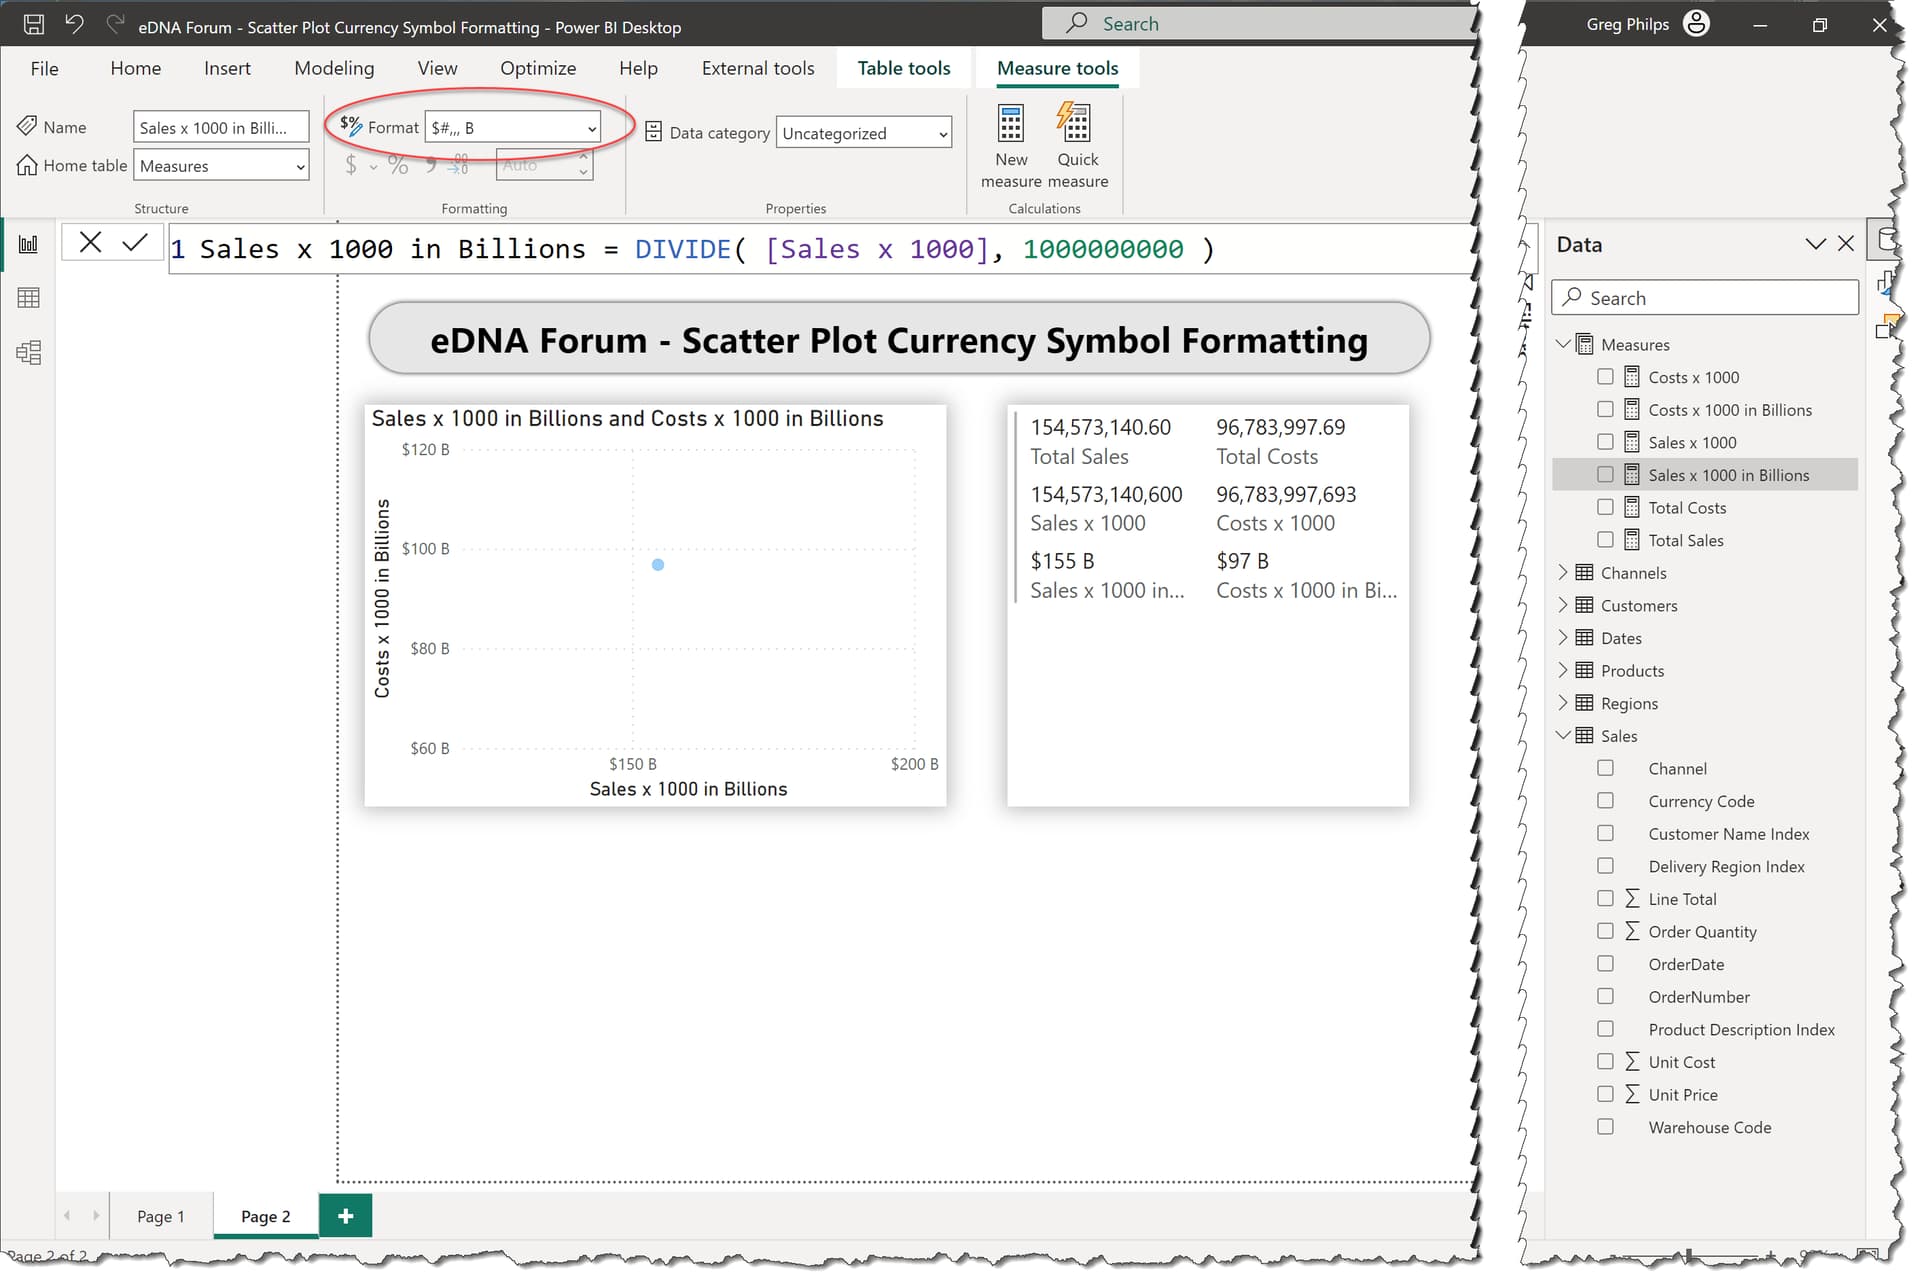
How can I change the formatting on X-axis and Y-axis on Scatter Plot to show values in “$B”?
The default Power BI formatting for bilions is “bn”, whereas I would like to have “B” instead.
Example:
Power BI Formatting: $6bn
My desired outcome: $6B
I know I can use “FORMAT” DAX function, but this will work only with tables because the data type will be changed to text, so it will not be working for the charts. So this doesn’t solve my problem.