Cumulative Year To Date & Monthly Average Year To Date

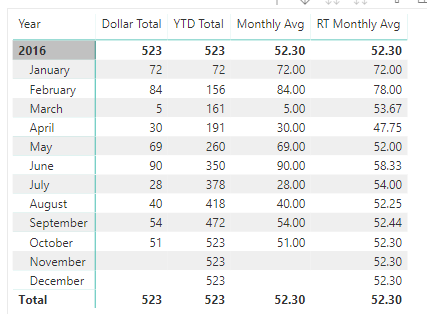
I am trying to get the results like the below

Here are my amounts below

Table ‘Ledger’

Date ActualDollars
1/3/2016 24
1/25/2016 15
1/31/2016 33
2/6/2016 15
2/10/2016 39
2/25/2016 30
3/1/2016 5
4/2/2016 10
4/20/2016 20
5/5/2016 15
5/15/2016 24
5/20/2016 30
6/1/2016 15
6/5/2016 30
6/23/2016 45
7/1/2016 28
8/5/2016 24
8/12/2016 16
9/1/2016 27
9/3/2016 18
9/5/2016 9
10/1/2016 12
10/17/2016 15
10/30/2016 24

I’ve got the cumulative total (I believe) but I can’t work out how to calculated the avg as I work through the month

Cumulative Actual = TOTALYTD(SUM(Ledger[ActualDollars]),Ledger[GLDGJ],FILTER(ALL(Ledger_GLDJ[full_date]),Ledger_GLDJ[full_date] <= MAX(Ledger_GLDJ[full_date])))

Appreciate some assistance on this?

@J_Evans
First thing you need to do is create a Date table and related that to your Fact table here. Want to be sure have a column for Month and Month Name.

Also, since we are going to use some Time intelligence functions, be sure to mark that table as a date table

Here are the measures I used:
Dollar Total = SUM( Table1[ActualDollars] )
YTD Total = TOTALYTD( [Dollar Total], DimDate[Date])

Monthly Avg = 
AVERAGEX( VALUES(DimDate[Month]),[Dollar Total])

RT Monthly Avg = 
CALCULATE(
    [Monthly Avg],
    FILTER(
        ALL( DimDate),
        MAX( DimDate[Month]) >= DimDate[Month]
        && 
        MAX( DimDate[Year]) = DimDate[Year]
    )
)

Then with Year and Month on rows ( from our date table) we get the following:
Monthly%20Avg%20from%20Daily%20Sales

Probably would want the values to stop after October, but I didnt want to have all the fun :slight_smile:

Nick

Enterprise%20DNA%20Expert%20-%20Small

Nice one Nick,

Great solution on this one.