Cumulative weekly sales measure

Hello Fellow Power BI Users -

I have used a weekly dax measure which you have introduced in one of the Youtube video as follow:-

Cumulative LYYTD-custom Wkly Sales = 
Var Currentweek= SELECTEDVALUE('Date'[New Week Num])
Var Currentyear= SELECTEDVALUE('Date'[Year-Thurs])

Return
calculate([Total sale],
       filter(all('Date'),
         'Date'[New Week Num] = Currentweek &&
         'Date'[Year-Thurs] = Currentyear - 1 ))

However, when I dragged this measure to canvas, cant display visual and the error message as follow:-

Error Message:

MdxScript(Model) (100, 10) Calculation error in measure ‘Key Measure’[Cumulative LYYTD-custom Wkly Sales]: DAX comparison operations do not support comparing values of type Text with values of type Number. Consider using the VALUE or FORMAT function to convert one of the values.

Please advise what went wrong and how to correct the measure. Thanks.

Convert your year column in your date table to a whole number data type. That will do it.

Hopefully this was sorted for you. Let me know if now.

Side note for inputting formula into forum. See here - https://forum.enterprisedna.co/t/how-place-dax-formula-into-forum-topics-posts/156/3

Thanks. I got it.

I wrote a measure for the growth of cumulative sales, ie cumulative sales TYYTD weekly sales - cumulative LYYTD weekly sales. When I displayed the result in table, it is fine. However, if I displayed the result in Card, it turned out blank as follow:-

Inline image

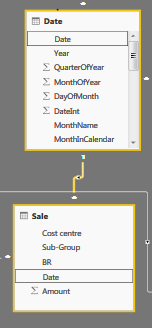
My data model is Date in date table is linked to date in sales table. Do I need to build a relationship between New Week Num in date table to date in sales table in order for the result to be displayed in Card? Please advise. Thanks.

No you don’t need any extra relationships.

Have you reviewed this videos here, I’ve look to create a number of these to assist with problems on totals

Yes. Please advise how to incorporate the measure of cumulative weekly sales (listed below) into the measure which shown in the video.

Cumulative weekly sales measure :-   
    Var Currentweek= SELECTEDVALUE('Date'[New Week Num])
    Var Currentyear= SELECTEDVALUE('Date'[Year-Thurs])

    Return
    calculate([Total sale],
           filter(all('Date'),
             'Date'[New Week Num]= Currentweek &&
             'Date'[Year-Thurs]=Currentyear ))

Measure shown in video:

Monthly Averages=
Var MonthlyAverage = AVERAGEX(VALUES(Dates[Month & Year]), [total Sales])
Var AverageTotal = Summarize(Dates, Dates[MonthName], "Monthly Avg", MonthlyAverage)

Return
If(HASONEVALUE(dates[MonthName]),
  MonthlyAverage,
     Sumx(averageTotal, [Monthly Avg])

Can you please send me your model, I can’t replicate exactly what you need in my own datasets. Thanks

This is the data model

Capture

Try this patterns here

Total Sales YTD - Custom 2 = 
VAR CurrentFinWeek = MAX( 'Calendar Daily'[Fin Week Number] )
VAR CurrentFinYear = MAX( 'Calendar Daily'[Fin Year] )

RETURN
SUMX(
	FILTER( 
        SUMMARIZE( ALL( 'Calendar Daily' ), 'Calendar Daily'[Fin Year], 'Calendar Daily'[Fin Week Number],
        "Sales", [Total Sales] ) ,
		'Calendar Daily'[Fin Year] = CurrentFinYear &&
		'Calendar Daily'[Fin Week Number] <= CurrentFinWeek ), 
    [Sales] )

Here’s an entire video on this.

You may need to make slight adjustments but this explains everything.

Thanks

Hi Sam,
First, I would like to thank you for all that you do on here - amazing stuff that I’ve taken me from nowhere to somewhat intermediate Power BI user. I’ve been feeding off mostly from the questions you answer on this forum.

Question 1: My first measure works fine with the correct calculation per each line item including grand total but gives me incorrect number when displayed on a card visual.

This is the query

PriorDayTotalEnt_CY = 
VAR CurrentDay = SELECTEDVALUE(PBICalTableAll[DayNumInFiscalYear])
VAR CurrentYear = SELECTEDVALUE(PBICalTableAll[FiscalYear])
                                                                                                                                                                                                      
RETURN
SUMX(
FILTER(                                                                                                                                                                                                     SUMMARIZE(ALL(PBICalTableAll),PBICalTableAll[FiscalYear],PBICalTableAll[DayNumInFiscalYear],                                                                                                           "EntCnt",[EntreeCounTotal.]),
PBICalTableAll[DayNumInFiscalYear]= CurrentDay && 
PBICalTableAll[FiscalYear] = CurrentYear),                                                                                                                                                              [EntreeCounTotal.])+0

Question 2: My second qumeasure for prior year created with no error message but shows zero for each line on the table visual.

Here’s the query

PriorDayTotalEnt_PY = 
VAR CurrentDay = SELECTEDVALUE(PBICalTableAll[DayNumInFiscalYear])
VAR CurrentYear = SELECTEDVALUE(PBICalTableAll[FiscalYear])
Var LastSalesDate =TODAY()-1

RETURN
IF(MIN(PBICalTableAll[FiscalDate]) <= LastSalesDate,
SUMX(
FILTER(                                                                                                                                                                                                     SUMMARIZE(ALL(PBICalTableAll),PBICalTableAll[FiscalYear],PBICalTableAll[DayNumInFiscalYear],                                                                                                           "EntCnt",[EntreeCounTotal.]),
PBICalTableAll[DayNumInFiscalYear]= CurrentDay && 
PBICalTableAll[FiscalYear] = CurrentYear-1),                                                                                                                                                              [EntreeCounTotal.])+0)

I am using a DirectQuery mode with more than 80 million records

Please advise.

Just a couple of things that I’m not sure about.

First can you show me the grand total and the card so I can see the difference. It’s hard to know what could be happening without seeing the numbers. To me it would have to be something to do with the context of the results because they are basically exactly the same thing.

Also why is there a +0 at the end of the formulas?

Not sure why you have this.

Also direct query is notoriously bad when it comes to complex measures. Most just don’t even work.

There’s a few variables at play here so need to see more.

Chrs
Sam

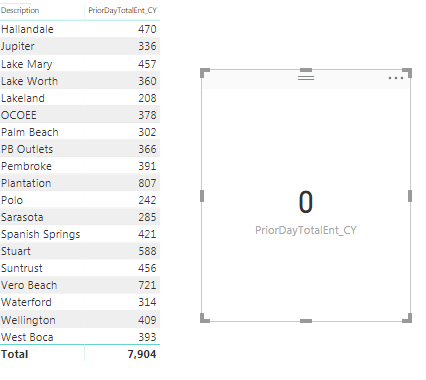
Here’s the table and the card visuals
The zeros at the end of the measure is for measure to return zero instead of blank where no data exist for a given location—don’t know of a better approach.
I am using direct query because there is over 50 million records in three of my tables. When I use Import mode and make a change in the query editor it takes endless time to update…I waited almost an hour one time while update is still running. The DirectQuery on the other hand takes about a minute or less. I’d preferred import mode to apply most of your techniques but only this limitation on my data size holding me up…Data stored in Azure.

image

I’m not sure at the moment as can’t replicate this exact scenario well at my end.

I think the + 0 could be the issue though. I wouldn’t recommend doing it this way.

Can you try something at your end…

Instead of doing that can you add logic that specifically says if the result is blank = zero.

Can you try just adding this to the FALSE part of the IF equation here. It’s doesn’t seem that anything is in that part at the moment.

This is all I can think off right now.

Thank you for your advise, Sam…I will keep trying different options.