Hi everyone
I thought i understood the cumulative dax measure but i guess not.
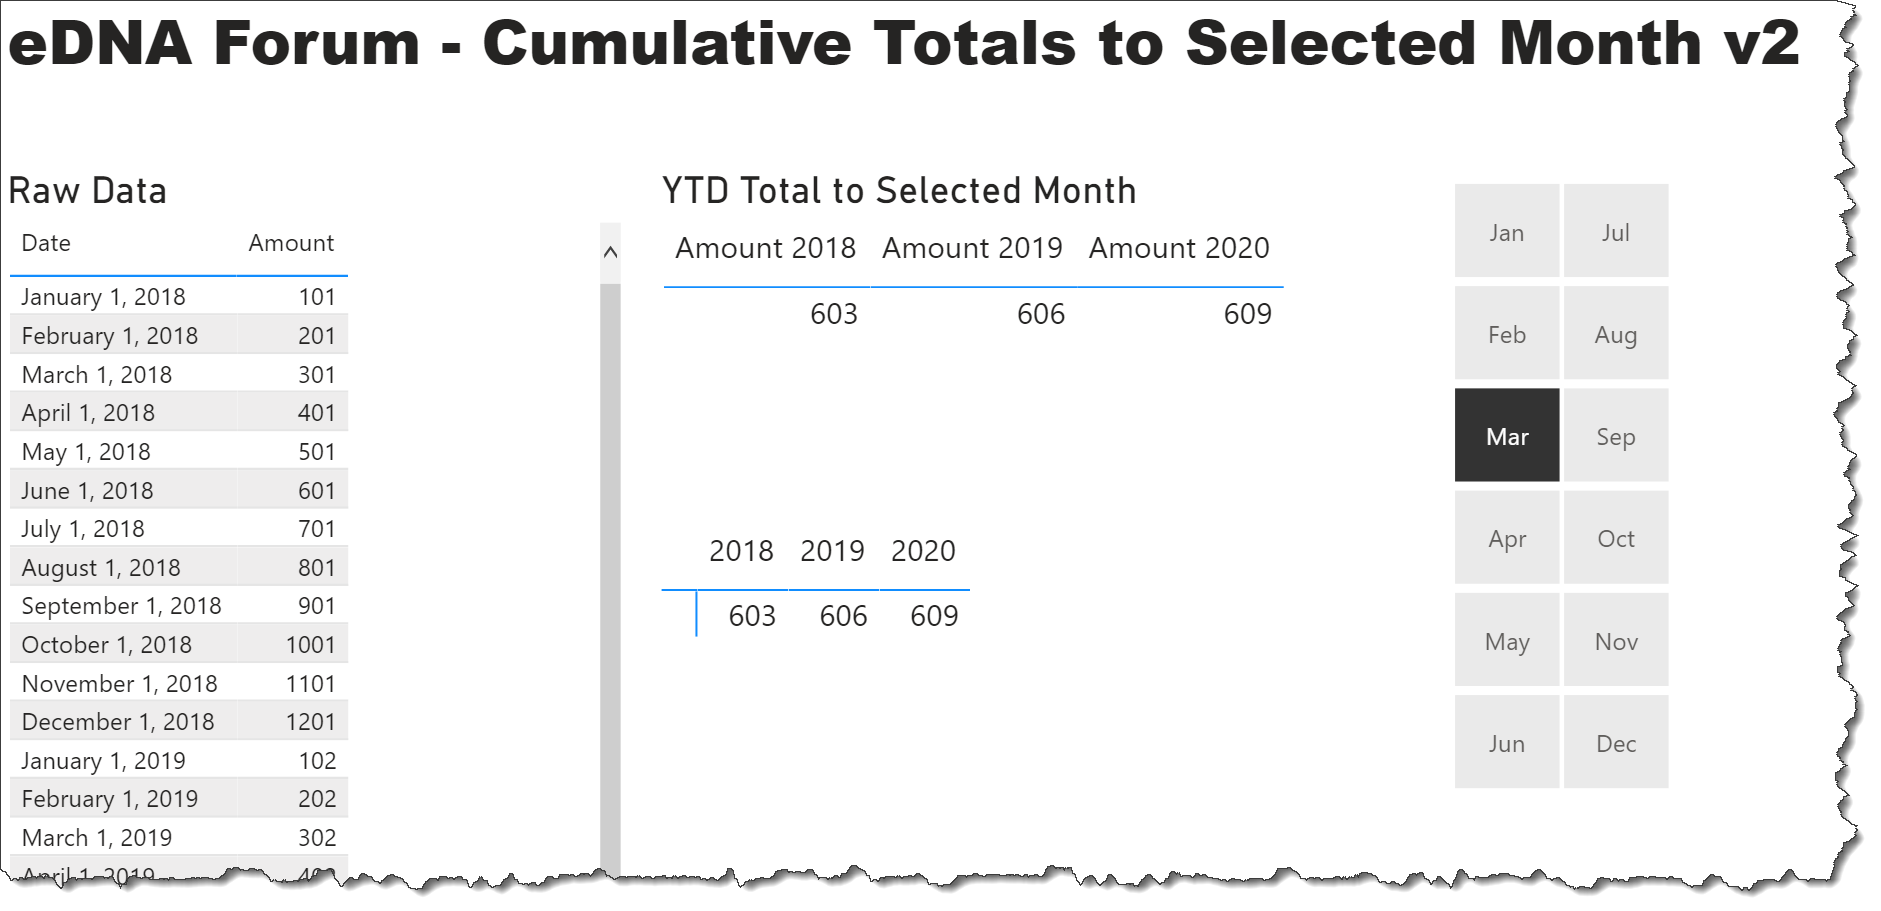
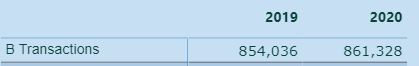
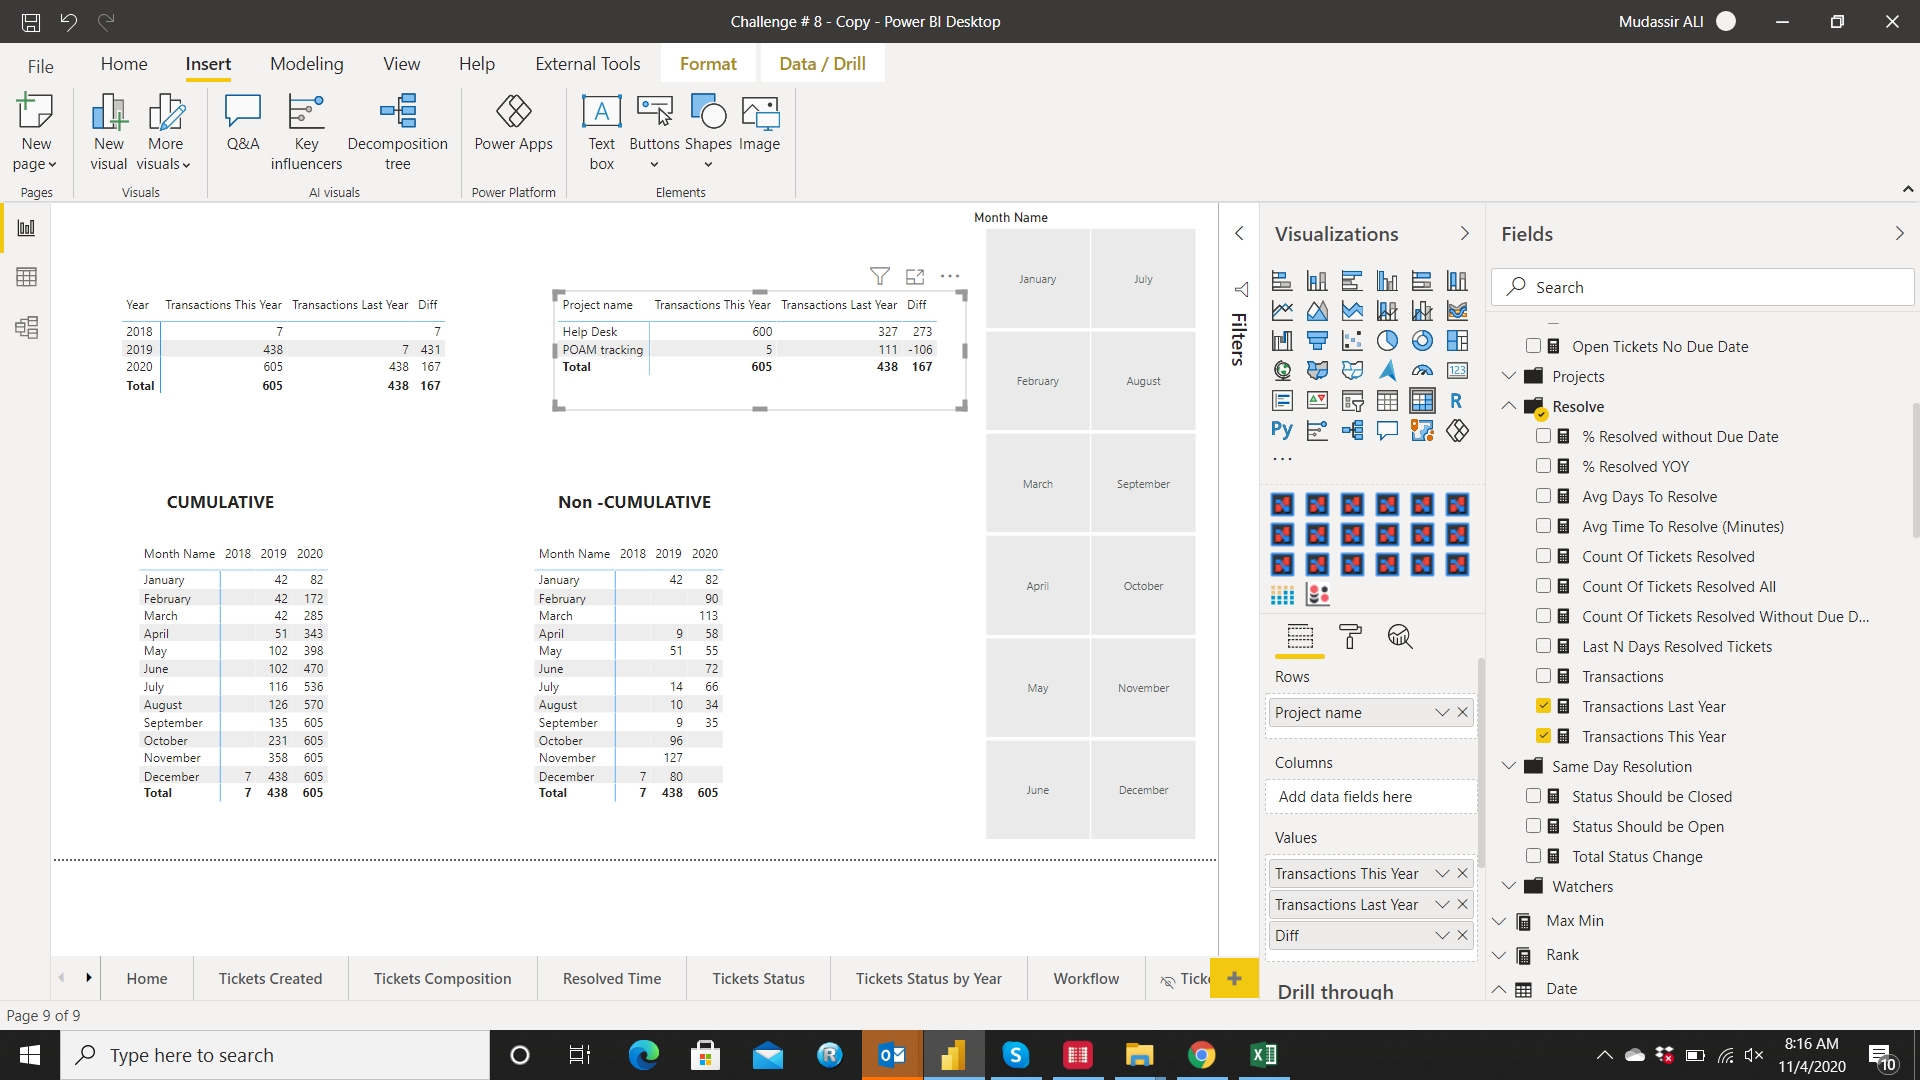
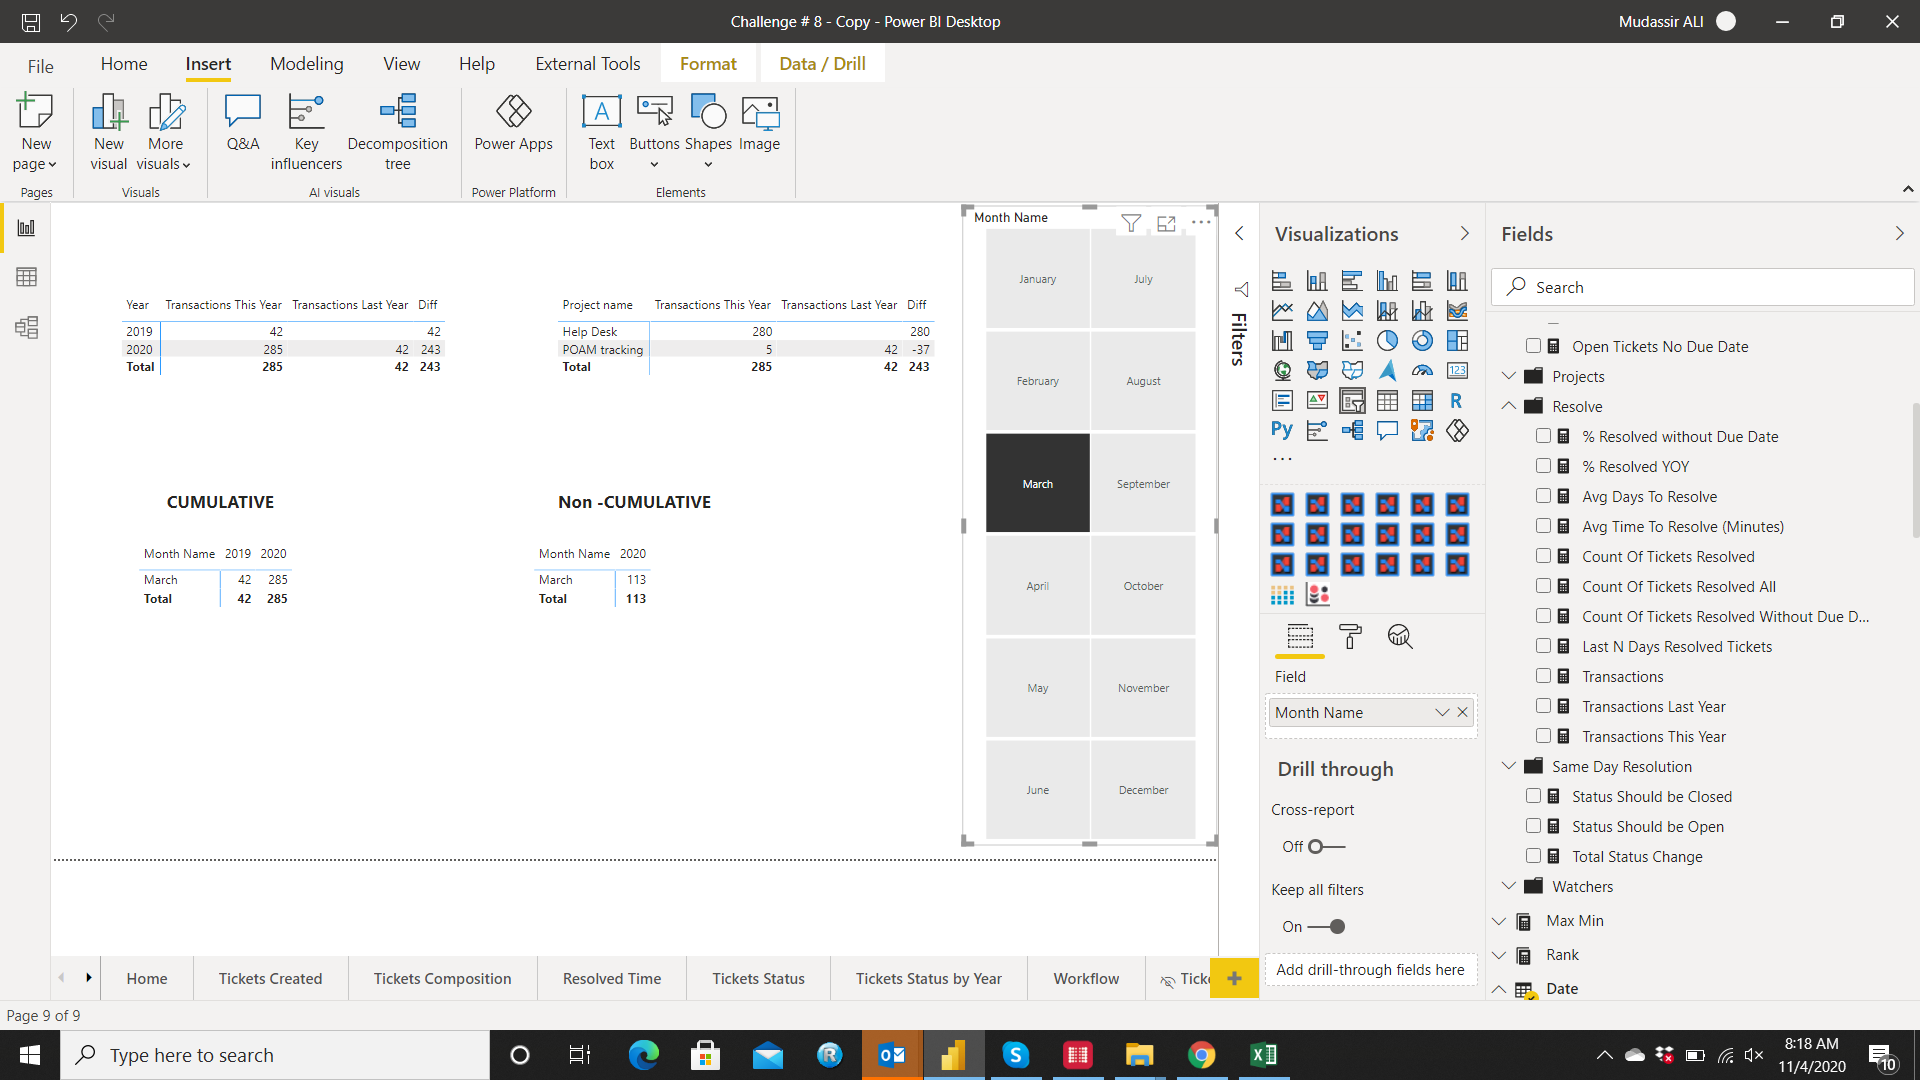
I need a measure to show me in a visual table the total transactions for this year and last year, like this:
In my report view, besides this table and others, i have the filter month, which if i choose any month, it shows me the cumulative up until that month.
I also need the same measure but for a particular year, let’s says 2019, in order to be able to do another for the differences, values and percentages.
Finally, could you explain me that formula so i can understand it?
Thanks a lot all of you
Pedro
P.S. I have my Transactions Table connected to my Dates table
There are different approaches to get the cumulative totals. Here are some videos that explain in detail how to calculate the cumulative totals in different scenarios. I believe the first video is related to the cumulative total you are looking for.
Thank you bery much @MudassirAli
It didn’t help because all these videos have the same context, which is dates and my need is to show without the context, like my picture above, you know?
Thanks anyway thow
@pedroccamara Can you please share some data and provide some explanation to what exactly you want to achieve pointing out exactly how everything would end up looking.
Hey @AntrikshSharma
Glad to see you here. I’ve seen so many videos and so far, none of them suits me.
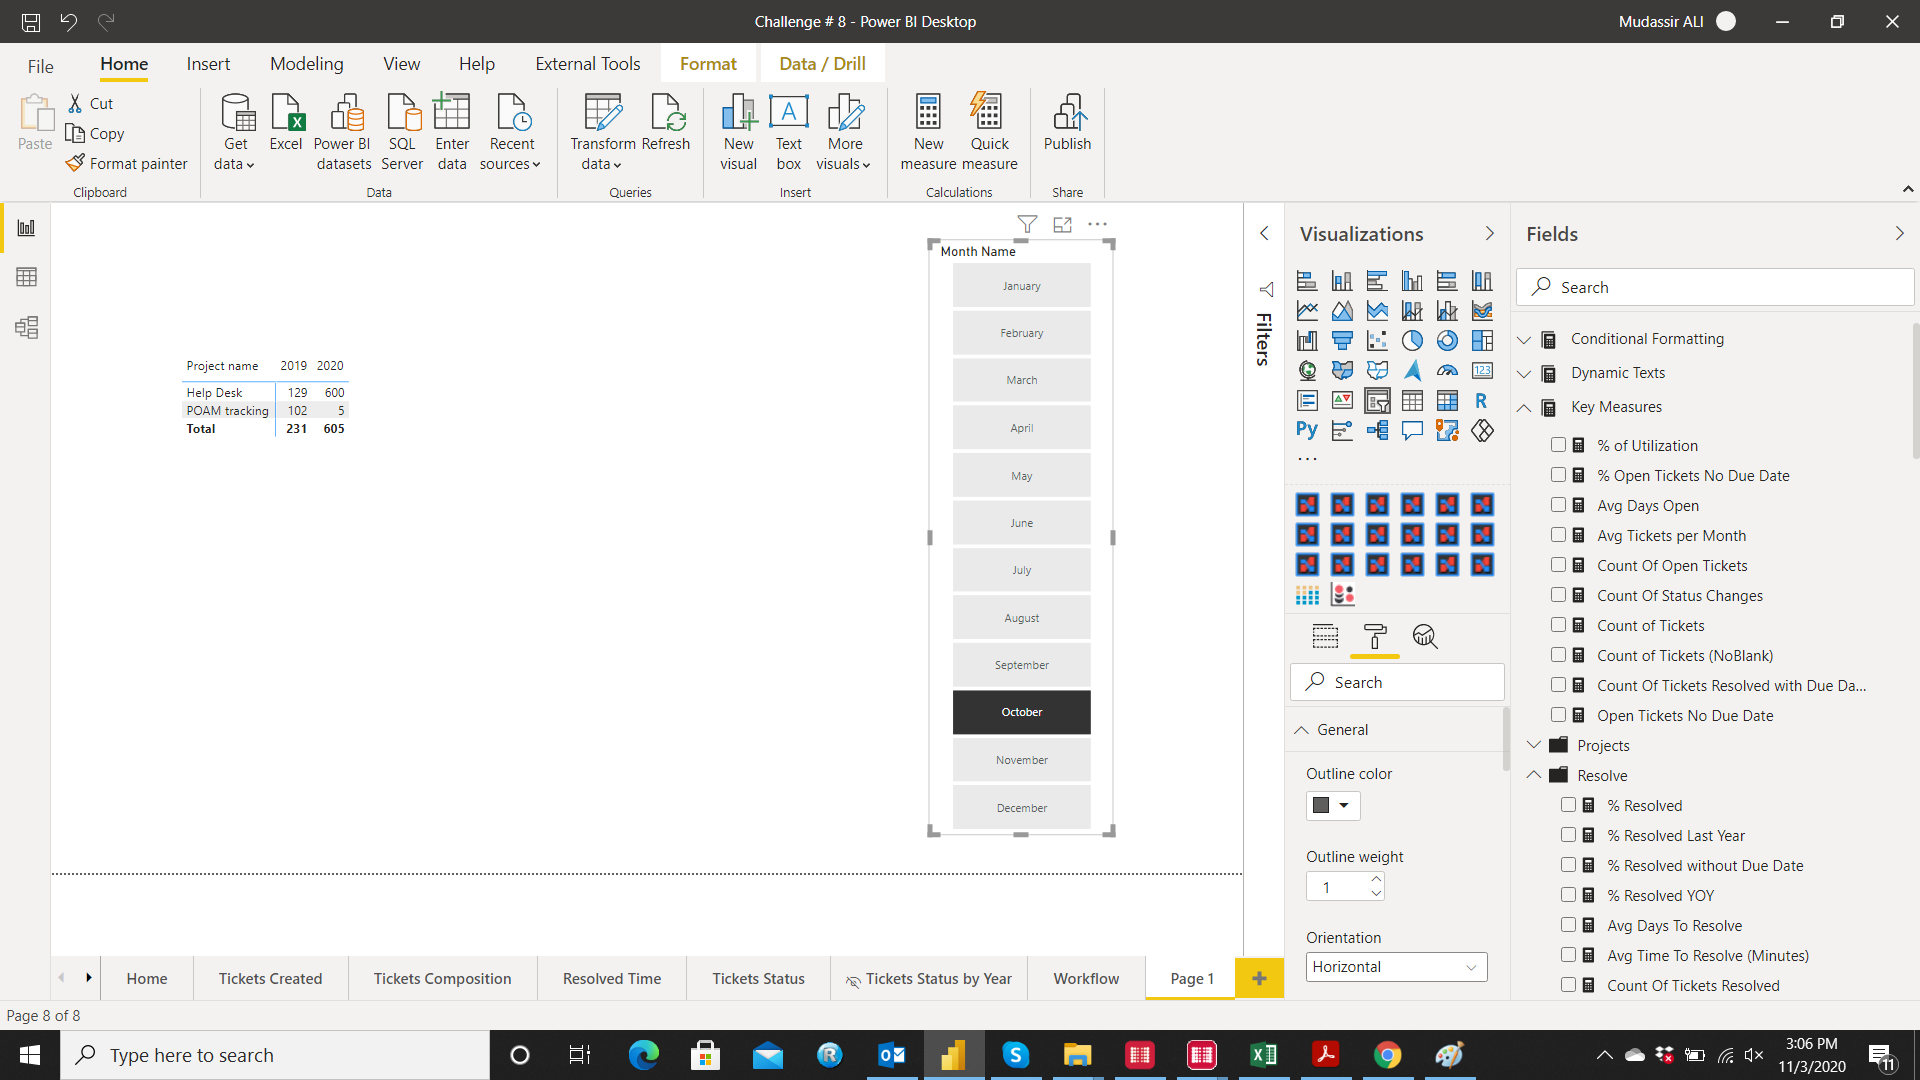
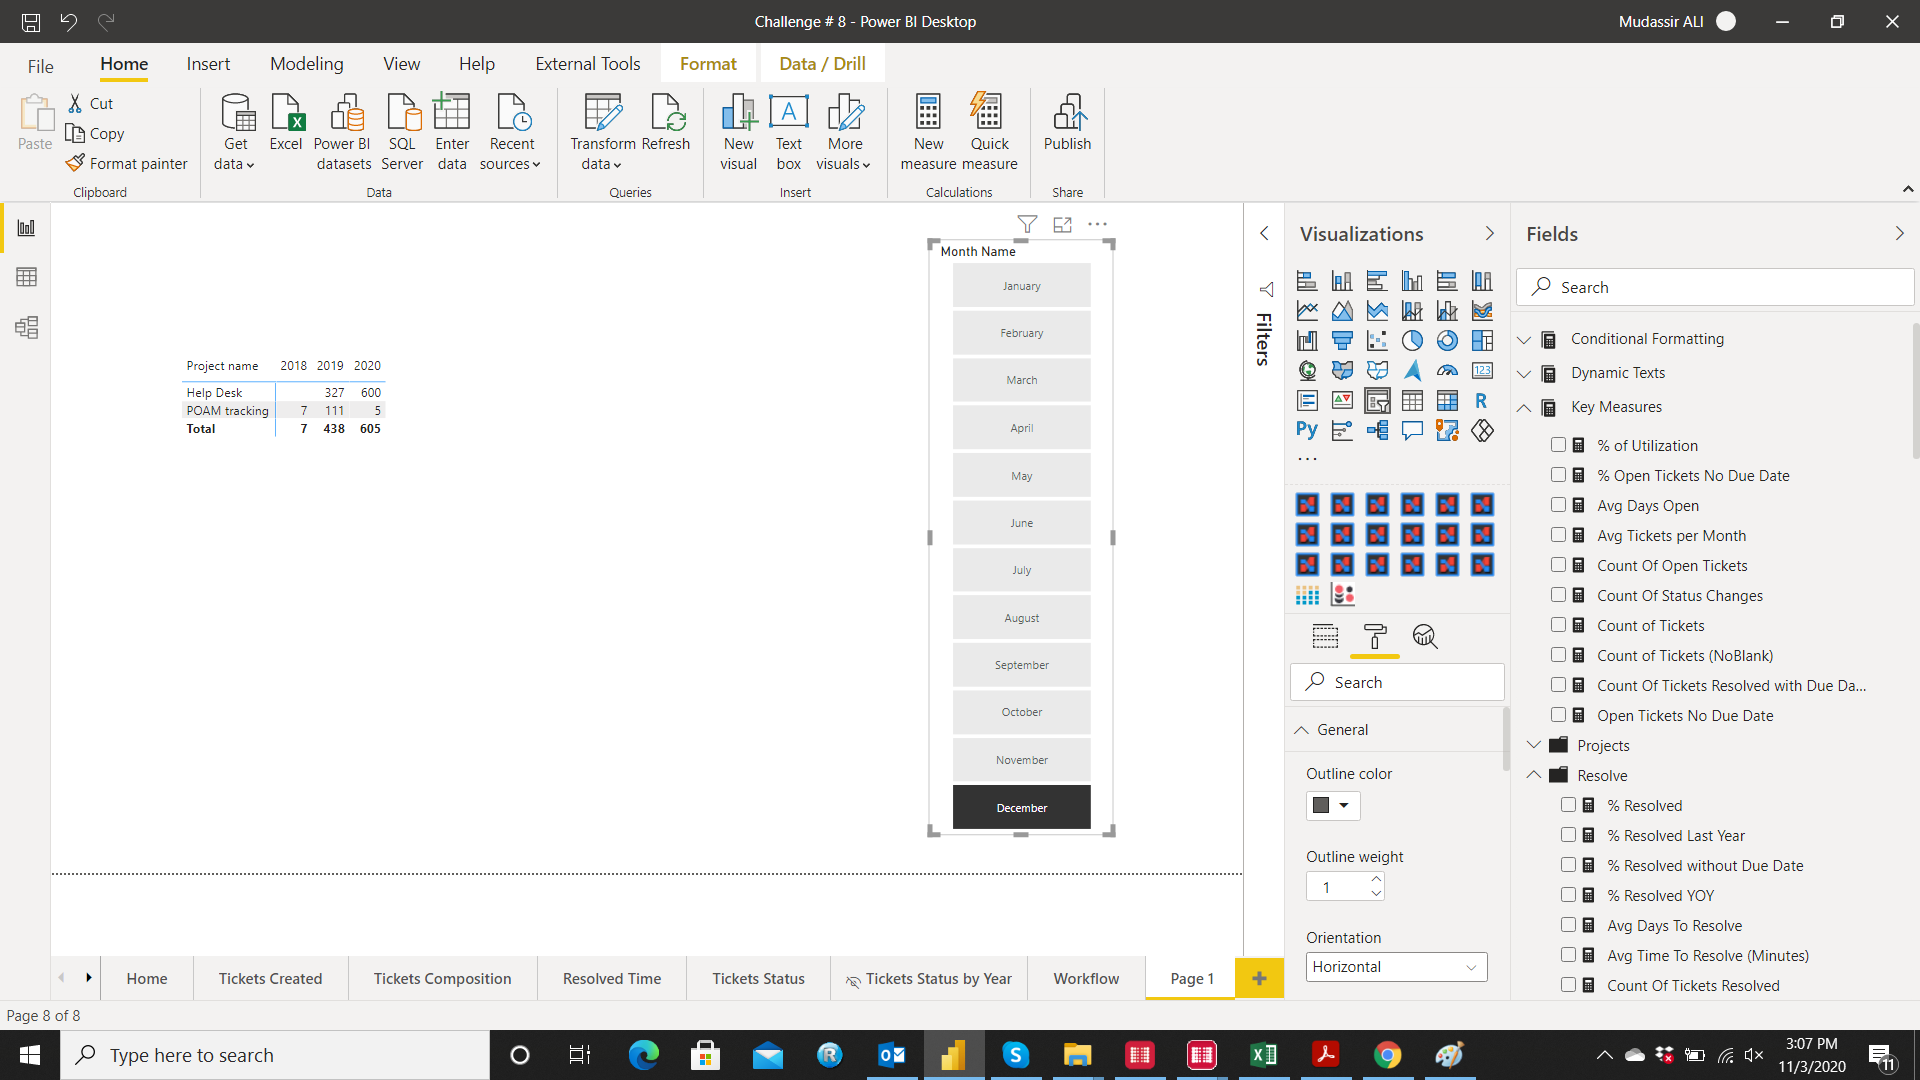
The data is completely irrelevant. Any kind will do. The purpose of this is having something like this:
There’s some measures and with this matrix visual, i’ve add year to columns. Now i want to see the cumulative values till any particular month that i choose.
I’ve tried many measures but they all show me zero when i pick a month.
@pedroccamara
Your Transactions table is connected to your Dates Table then you can achieve this with DATESYTD function. When using in a matrix, you don’t have to use the Date Context to show the results.
The measure used to achieve the result is:
Transactions Cumulative =
CALCULATE(‘Key Measures’[Count Of Tickets Resolved],
DATESYTD(‘Date’[Date]))
Thanks a lot @MudassirAli
(It works perfectly! Awesome!)
After i’ve checked the values @MudassirAli, it seems to work because of my month filter. Let me explain : if i select 1 month, say Mar, it shows only Mar and it’s suppose to show from Jan till Mar, you know? But if i select Jan, Feb and Mar, it works but it’s not the purpose. The purpose it’s to select just one month and show the cumulative till that month.
Could you change your measure in order to work?
Thank you very much
Hey @Greg!
Thanks for your message. I’m not sure but i believe your measure “sounds” like a regular measure of a chosen month right? And if so, what is the diff between your measure and a simple calculate sales with filter for 2020? Also, don’t forget that we were trying to have cumulative values until the month chosen.
I haven’t checked yet the values but at least they “don’t go away” when i choose a month…
Regular measure? Mine does total for the specified year for all months up-to-and-including the selected (disconnected) month. Hope it looks good after your check.
Greg
Hey @Greg
I’m so sorry, I didn’t mean to say it wasn’t a good measure. For me, that i’m very litle experienced in dax, it sounds a regular formula.
Yes, it works on your example but not in mine, because i don’t have a disconnected date table and don’t know how to change it.
Also, it would be nice to have a measure for whatever year i got in my column matrix table, and then the “same” measure for a particular year so i can make the differences between them.
Could you help me?
Thanks a lot Greg
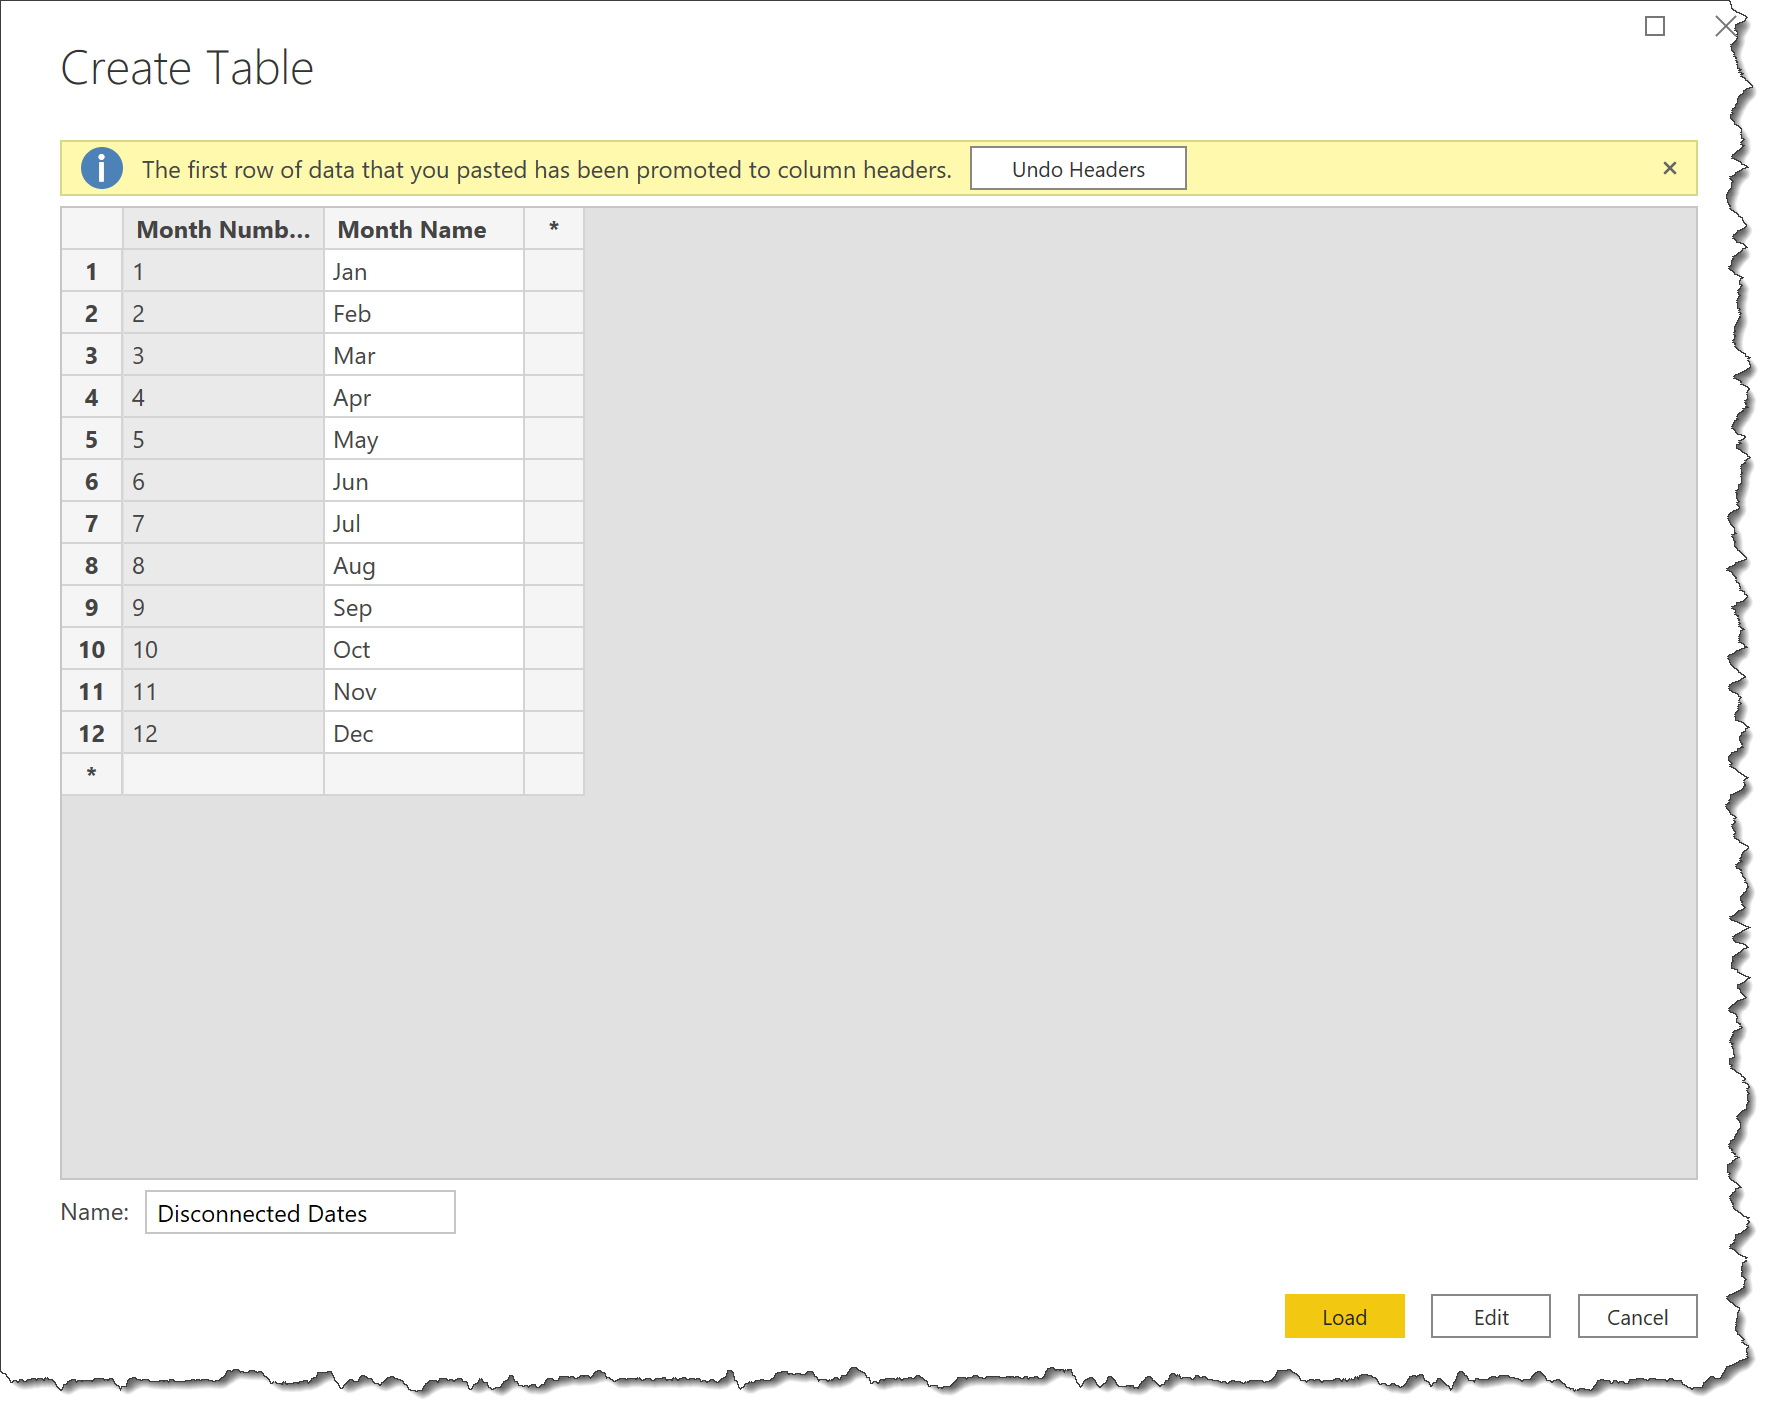
No worries @pedroccamara … I was mobile and didn’t reply fully: I didn’t understand what you meant by regular measure; yes, it is just a normal CALCULATE with a filter for both Year and Month. If you like, you can just add a “Disconnected Dates” table using “Enter Data”:
Hi again @Greg
I guess you’re right. I believe it would work with that disconnected dates table but i would rather have not another table in my model. It would b awesome if you find a way to do it without it.
Thanks a lot
Yes @MudassirAli, i think you’re right, but…
Could it be because you have a measure for each year?
Let me tell you what i have:
First measure just for cumulative values:
As Greg rightly said you would need a disconnected table for this, the logic behind this is that:
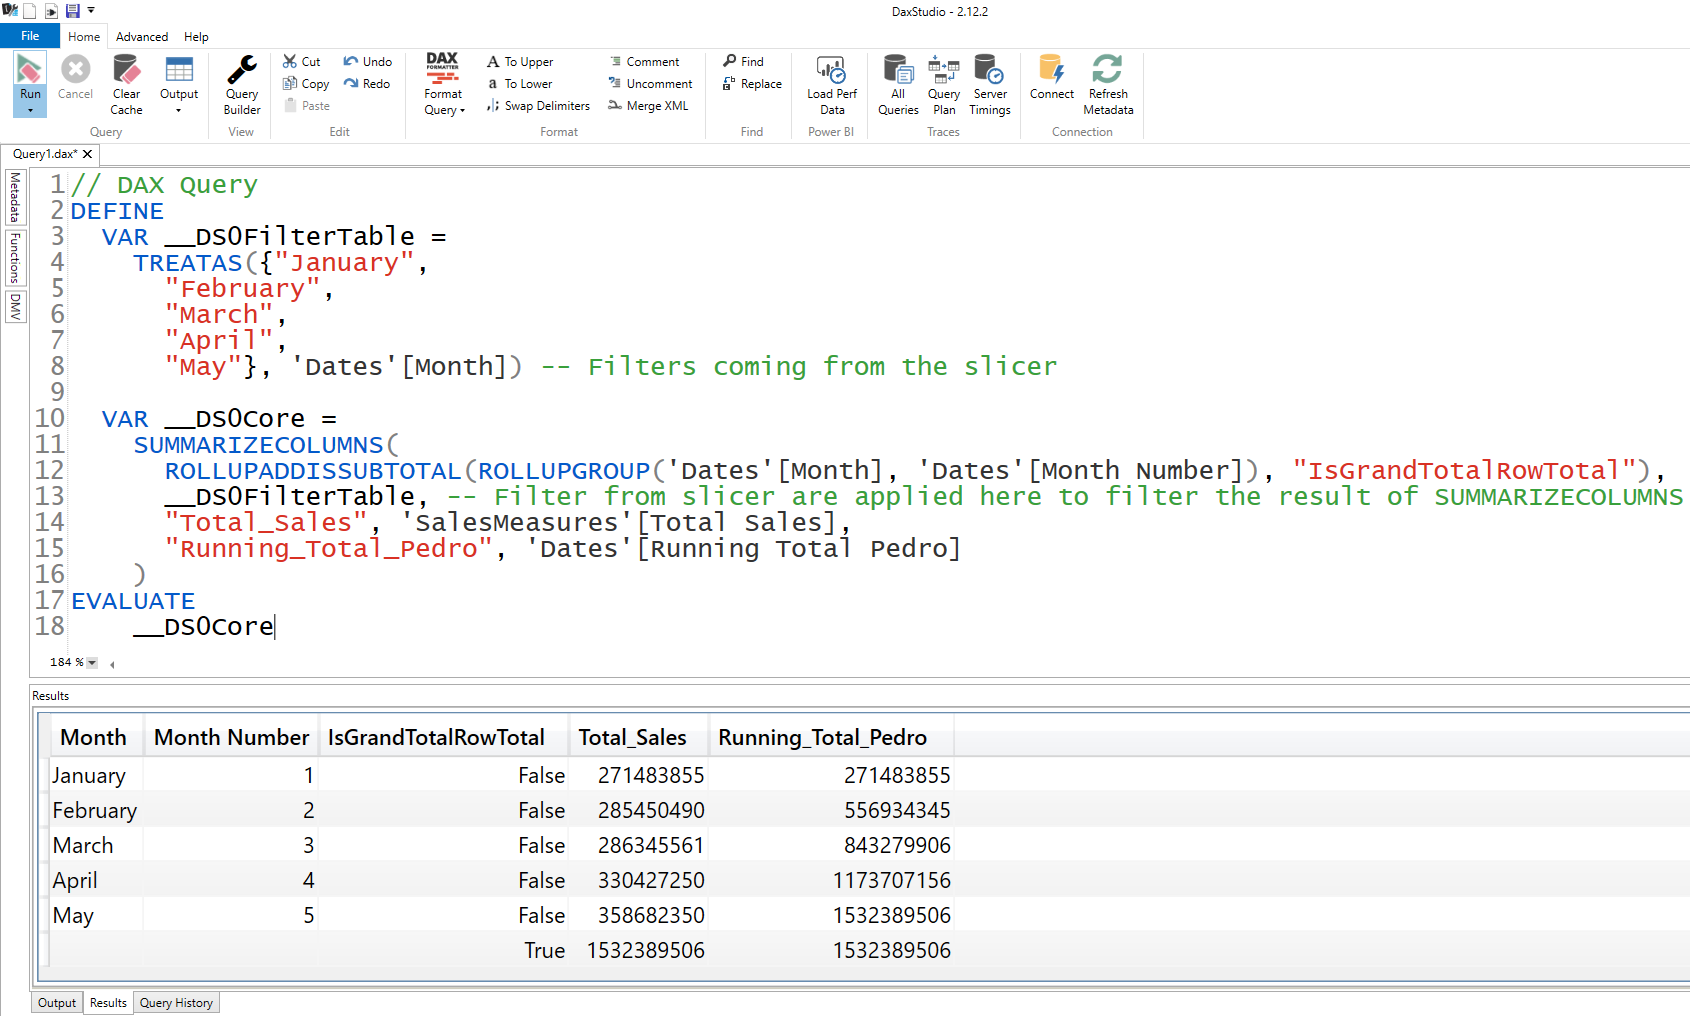
behind the scenes SUMMARIZECOLUMNS prepares the matrix and when you have a selection on a slicer then that code will filter query generated by SUMMARIZECOLUMNS, which will result in only those months that are selected in a slicer.
Before your DAX code in PBI starts working, SUMMARIZECOLUMNS has completed its task and gives you a matrix visual on which your DAX code has to work/iterate, so in order to get running total up to and including the month selected in the slicer you will need months selection coming from a separate table that doesn’t generate a query that filters the visual and also doesn’t have a data lineage of main Dates table.
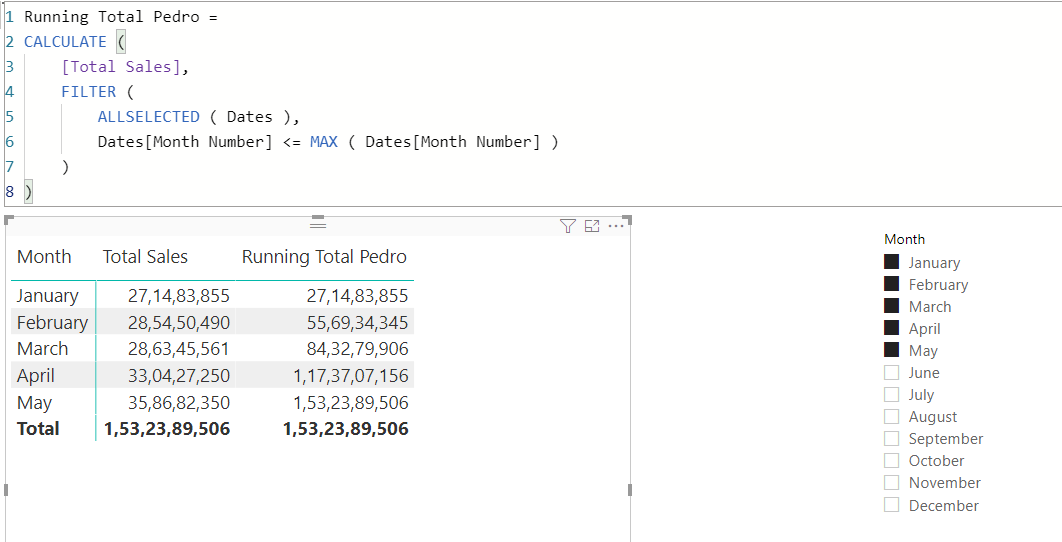
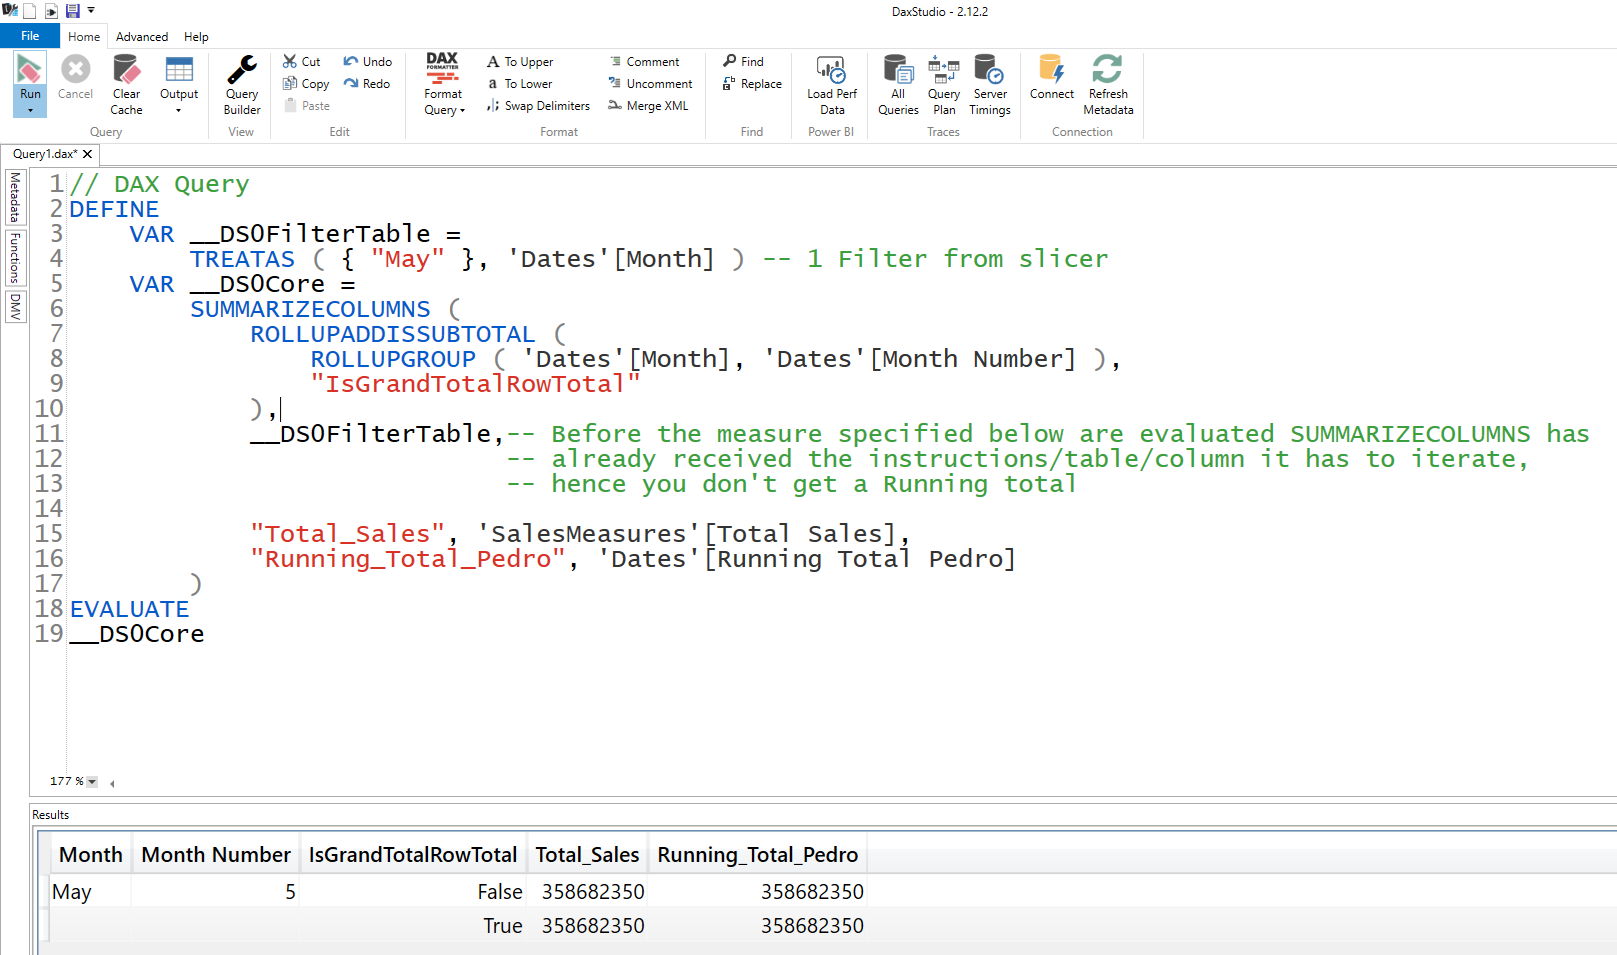
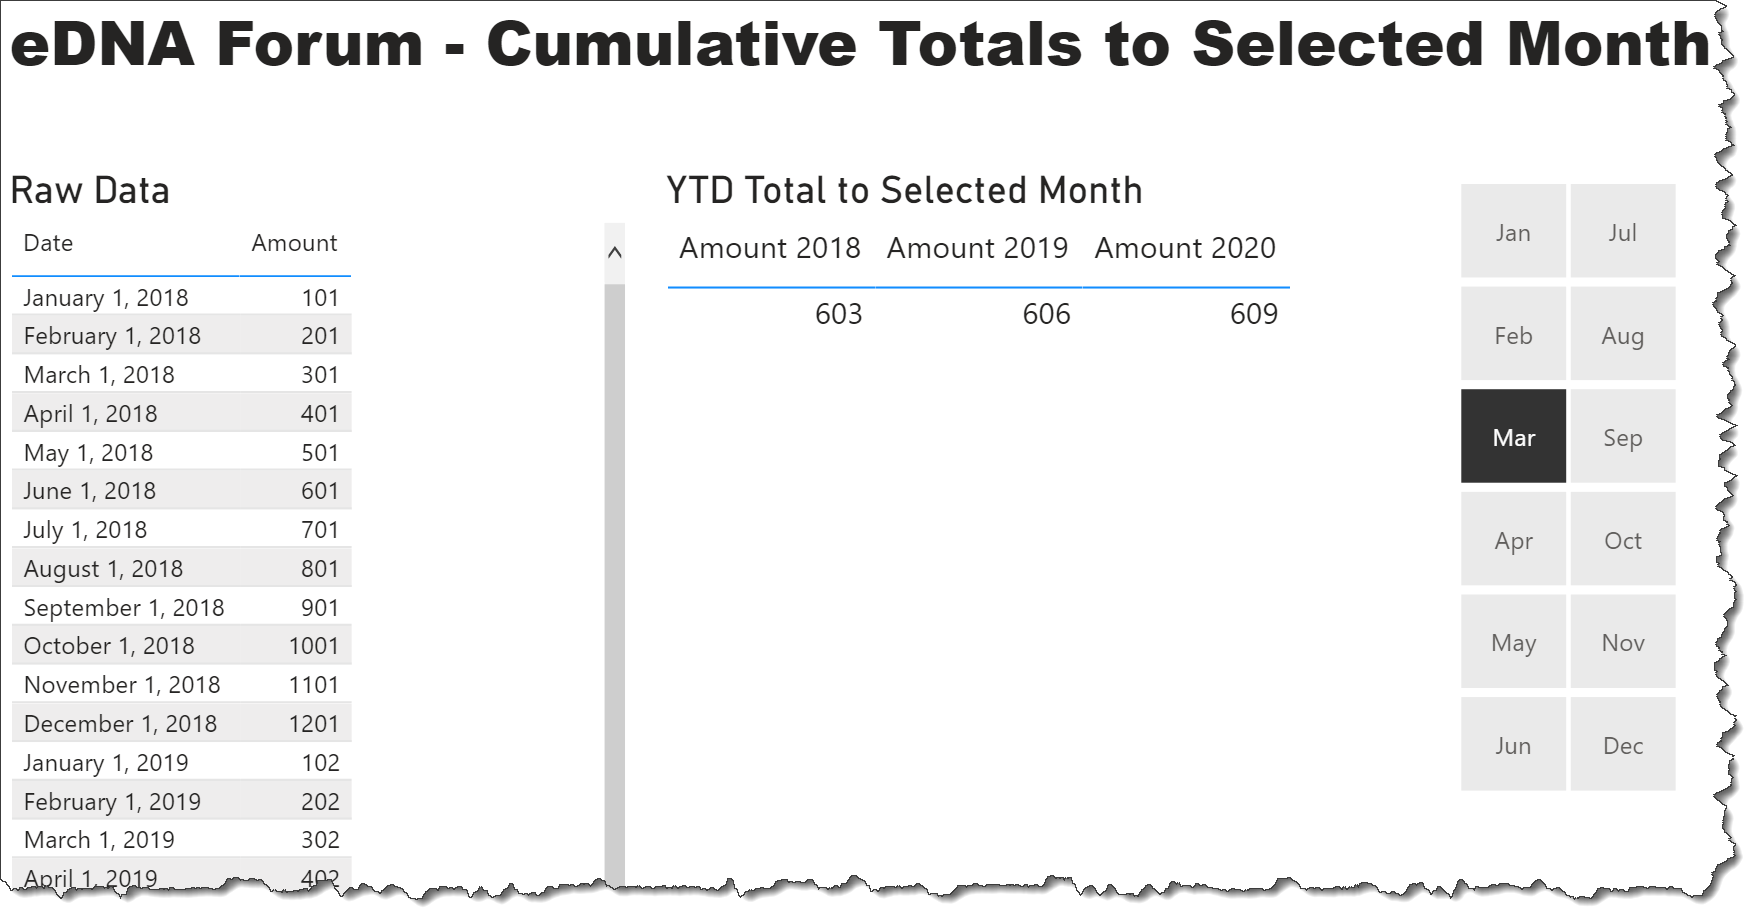
Here is how a running total like the following works, when you select multiple values it works as you want because all the selected months are returned by SUMMARIZECOLUMNS and in the filter context created by SUMMARIZECOLUMNS, MAX check for the MAX month:
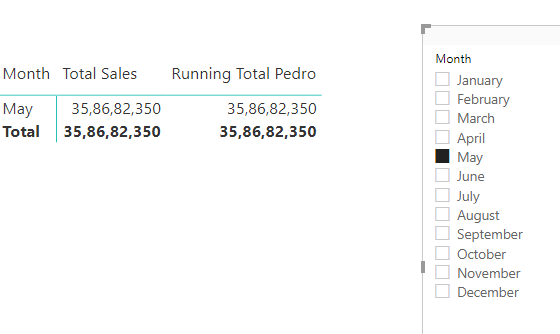
Problem is when you select only 1 value, SUMMARIZECOLUMNS returns only 1 selected value and that is always the MAX value, it is like being only student in a night class, you are the first, last, mean, median, mode, Standard deviation etc, lol!
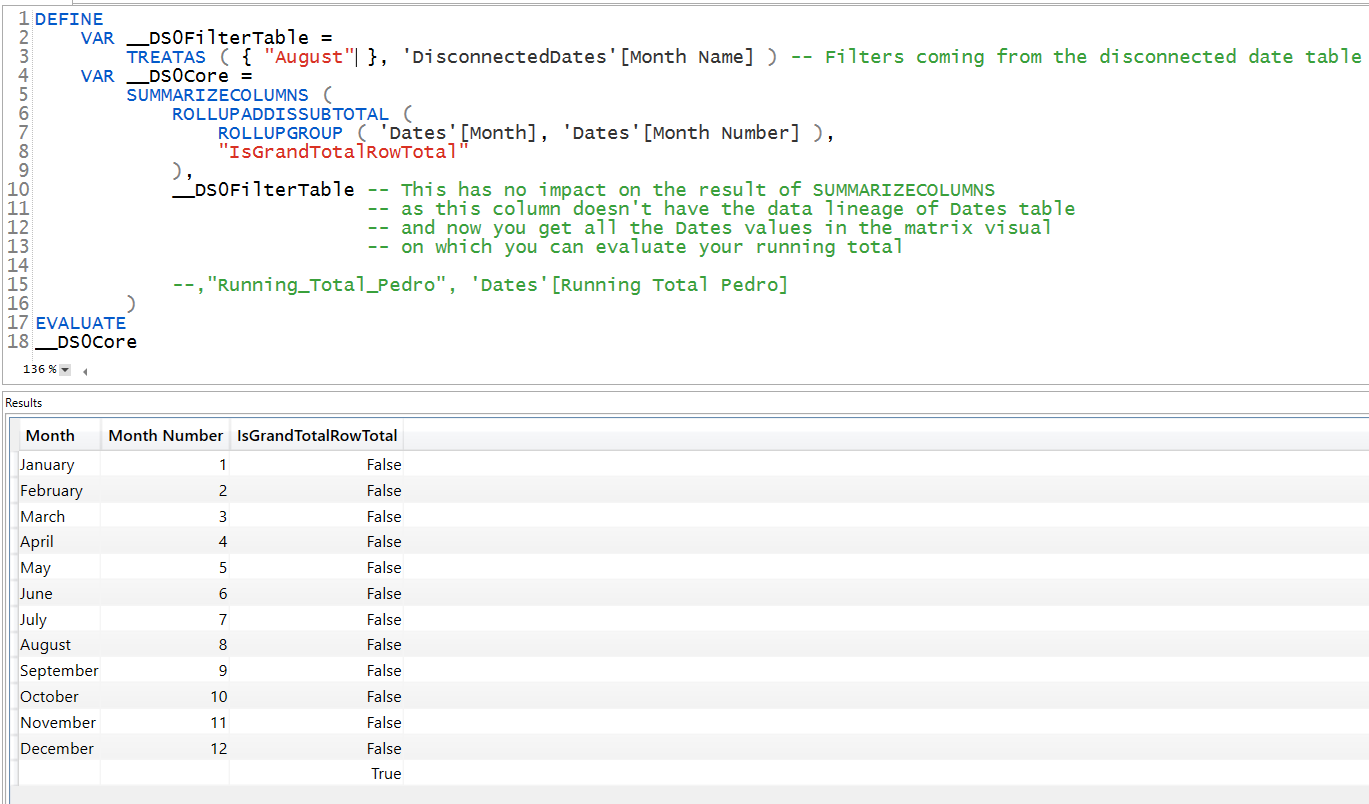
And when I uncomment the measure it gives the desired result, because of the statement
IF ( MAX ( Dates[Month Number] ) <= MaxMonthCurrentlySelected, Result )
Which returns BLANK if Month Number in the matrix is greater than the disconnected month selected in the slicer, and DAX engine automatically removes the blank rows from the visual:


 and your is…?