Hi everyone,
I am writing Cumulative Overead measures for current year (2019) vs Budget vs Last Year. The DAX are as follows:
CUMULATIVE OVERHEAD =
Var LastCashTransactionDate = CALCULATE( MAX( CashFlowTransactions[Date] ), ALL( CashFlowTransactions ) )
Return
if( SELECTEDVALUE( 'Calendar'[Date] ) > LastCashTransactionDate,
    BLANK(),
    CALCULATE(
        [Total Overhead],
        FILTER(
            ALLSELECTED( 'Calendar'),
            'Calendar'[Date] <= MAX( 'Calendar'[Date] )
        )
    )
)


CUMULATIVE OVEREAD BUDGET =
CALCULATE (
    [Total Overhead Budget],
    FILTER( ALLSELECTED( 'Calendar' ),
        'Calendar'[Date] <= MAX( 'Calendar'[Date] )
    )
)


CUMULATIVE OVERHEAD LY =
CALCULATE(
    [Total Overhead LY],
    FILTER( ALLSELECTED( 'Calendar' ),
        'Calendar'[Date] <= MAX( 'Calendar'[Date] )
    )
)
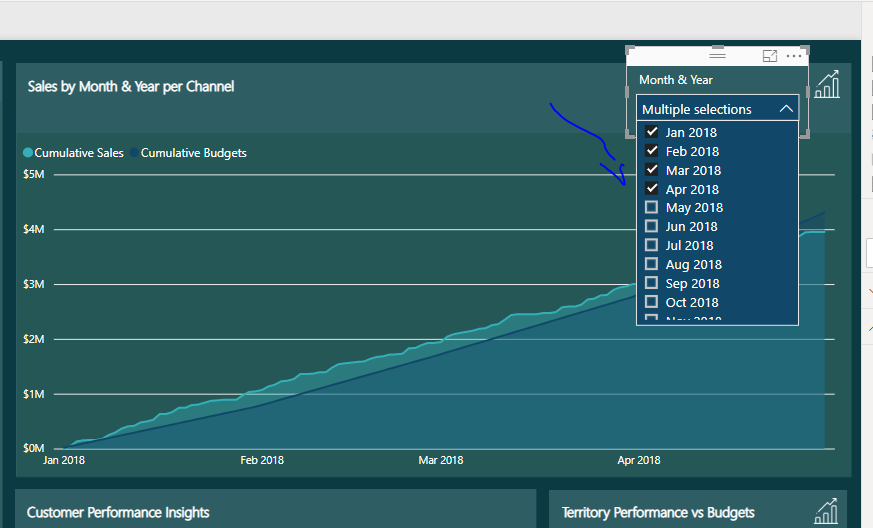
If all the months are selected, then the cumulative chart shows correctly: Budget and LY shows for all months until December.
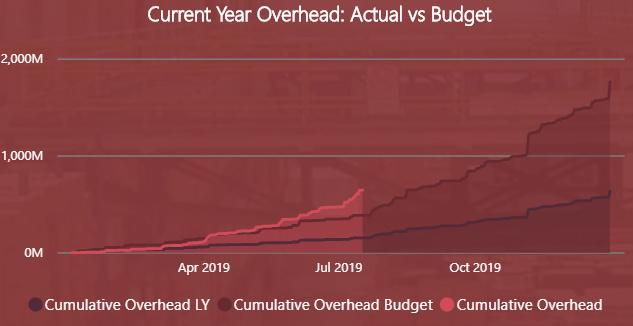
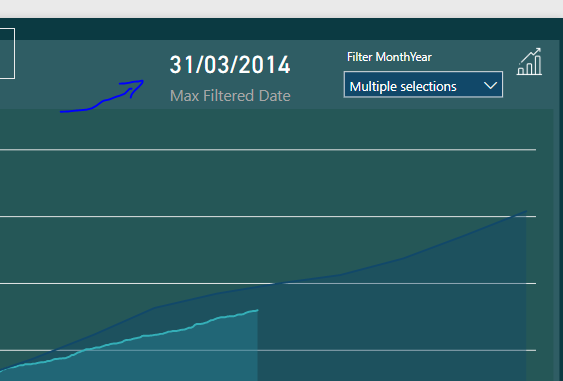
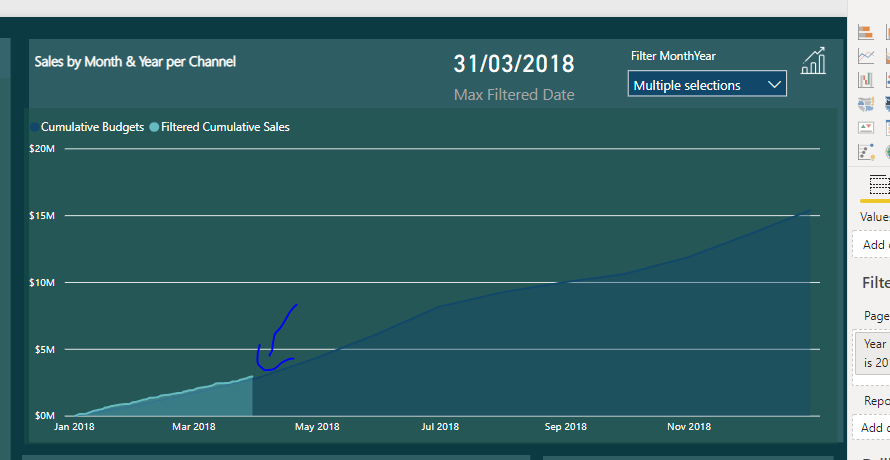
Now when I select certain months, for example January - March, it filters the Actual to March which is correct. However, the problem is Budget and LY are filtered to March only as well, while I want Budget and LY always show for all the months until December, as there are data for the full year for Budget and LY data.
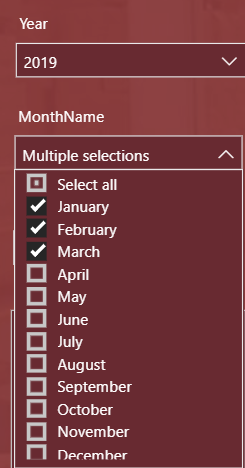
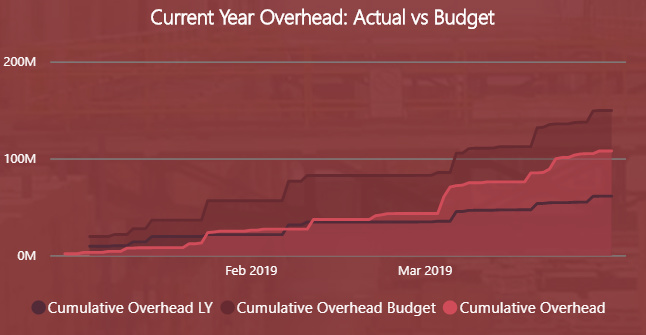
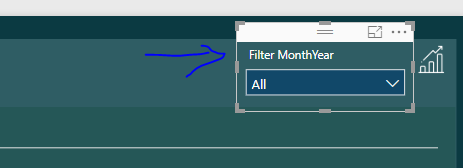
Could anyone please advise how to modify the Cumulative Budget and Cumulative LY measures above to ignore the month selection to always show full year data? (until Dec instead of March in the above screenshot example).
PS: Sorry for the long post as I do not have a simplified data model to share.
Thank you.