Hello,
I am struggling to get a DAX equation right to calculate a cumulative total by group and year.
I have a cumulative total that I want to convert to an annual cumulative total. I am using the following DAX which I modified from the related video.
Incremental Cost by Year3 = CALCULATE([Cumulative Total MAX] , FILTER(ALLSELECTED(Dates[Date]),Dates[Date]<=MAX(Dates[Date])))
Unfortunately, for many years, the totals are more than the sum of their parts. Thanks much for your kind assistance.
Here is a link to my .pbix file in case it is helpful. Cost and coverage model
Hello, my issue has been further complicated by the fact that the measure has been filtered by 2 IF statements (which I have introduced as seperate, sequential measures): the first limiting the amount of the increase after the 5th year; the second retaining one of the population/cost categories at a fixed increase (not subject to the same calcs as the other categories). All those measures seem to be working when I plug the final one into a stacked column chart. However, I cannot see that final measure in my table audit as I get an error message(?).
In any case, my main issue is that I want to create a new measure which sums the individual stacks (with the conditions) by year so I can have an annual total. Without the annual total the entire exercize is pointless…
I have literally watched over a dozen videos on this and dedicated no less than 80 hours to trial and error with DAX formulas (on solving this one issue!)… I am sure there is some simple solution that I am unaware of.
I greatly appreciate any guidance or insights the community can share. Here is my .pbix file: Cost modeling
I’m unable to download the model for some reason as is password protected. You can add the pbix file directly to the forum.
But I can quickly see this particular formula is unlikely to work due to the initial filtering being down by your table.
You will most likely have to play around with a combination of SUMX and SUMMARIZE to get this to work for you.
Here’s a good one to review
And here is another one around the same concept
The filter from the Vulnerable Groups is the issue and why the existing formula isn’t working. Utilizing the techniques showcased above will solve this for you.
Chrs
Sam
Cost Modeling 2.20.2019.pbix (246.2 KB)
Hello Sam,
Thanks for getting back to me. Please find attached my file. I decomposed the annual totals by group using PARELLELPERIOD and reconstructed a new measure, however, I still cannot get anything to work…
Hello again,
I have managed to get the SUMX and SUMMARIZE working to produce a total within the each year. However, the measure I am using in the formula is cumulative from the previous years. For example,
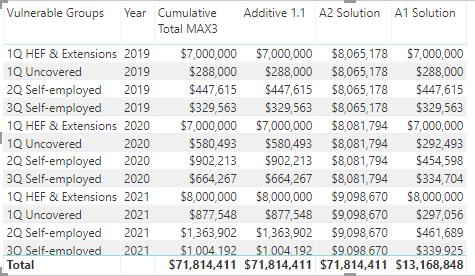
By comparing measures “Cumulative Total MAX3” or “Additive 1.1” with “A2 Solution” you can see it is working for 2019. However, for 2020 the sum of the 4 values is $9,146,973 compared to the result in the table which is $8,081,794. For some reason it is taking the non-cumulative values for all groups (compare with “A1 Solution”- EXCEPT for the 1Q HEF & Extensions. I attribute the exception to an IF statement on the measure. In fact, that is the way it should be. I am just looking to add in the annual increases for each year for the other groups. In fact, I am looking for either “Cumulative Total MAX3” or “Additive 1.1” to generate a total by year. Here is the formula as it stands:
A2 Solution = SUMX(FILTER(SUMMARIZE('Dates', Dates[Year], "Year Summary", [Cumulative Total], "Yearly Sum", ('Vulnerable Groups'), "X Factor" , [Cumulative Total]),
    MAX('Dates'[Year]) <= 'Dates'[Year]),
            [Year Summary])
I don’t think that filter changes anything, but I have left it in for now.
Thanks a ton in advance for any and all guidance you can provide. Greatly appreciates. Cost Modeling 2.20.2019.pbix (232.1 KB)
Hi Sam,
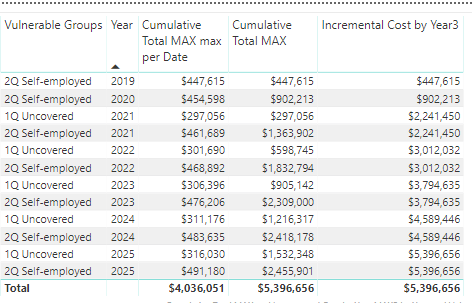
Hope you had a good weekend. I have managed to solve part of my issue by backwards engineering the data- i.e. changing the data in my data set to ensure only one possible result. However, my primary measure of interest “Incremental Cost by Year MAX” is ignoring the IF statement from the measure from which it is being calculated. Here is my new table which re-illustrates the problem I am having.
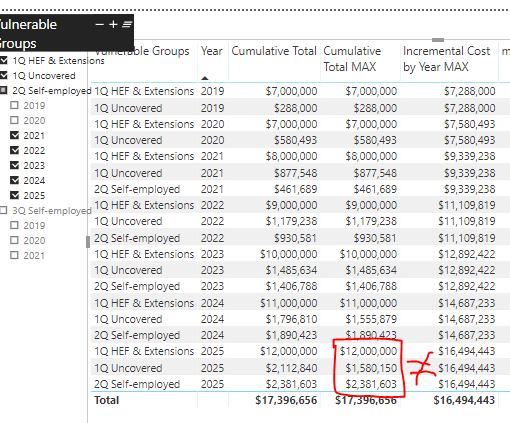
You can most clearly see it for Year 2025 where the result for “Incremental Cost by Year MAX” is $16,494,443. This is the sum of the “Cumulative Total” for the 3 groups in Year 2025. However, I need it to be the sum of “Cumulative Total MAX” for the 3 groups in Year 2025.
My formula for the “Cumulative Total MAX” is:
Cumulative Total MAX = IF ([Cumulative Total] >= [Total Cost Measure], [Total Cost Measure], [Cumulative Total])
And, my formula for “Incremental Cost by Year MAX” is:
    Incremental Cost by Year MAX =

    CALCULATE(
            [Cumulative Total MAX],
            FILTER(
                ALLSELECTED(MASTER),
                MAX(MASTER[Year]) >= MASTER[Year]
            )
        ,
            ALLSELECTED('Vulnerable Groups')
    )
I am guessing that the solution involves somehow wrapping my IF statement into my “Incremental Total by Year MAX” formula. I am uploading the latest version of my file and really appreciate any help you may be able to provide.
Cost Modeling 2.23.2019 TEST.pbix (262.4 KB)
Thanks much.
Robert
Ok sorry for the delay. I have spent some time on this and believe I have the right answer now.
I just needed to clear the mind and bit and attack it a different way.
I soon realized the this particular formula was the issue
It just doesn’t work as you require when you attempt to calc the incremental total
I also simplified everything down in the model. I was getting so confused by all the formulas that were in there.
I basically started from scratch.
Here are the formulas I used to get the below
Cumulative Total Alt =
VAR CurrentYear = SELECTEDVALUE( Dates[Year] )

RETURN
CALCULATE(
    SUMX( SUMMARIZE( Dates, Dates[Year], "Totals", [Total Cost Sum] ), [Totals] ),
        FILTER( ALLSELECTED( Dates[Year] ),
            Dates[Year] <= CurrentYear ) )


Cumulative Max Alt =
SUMX( VALUES( 'Vulnerable Groups'[Vulnerable Groups] ),
    IF( [Cumulative Total Alt] >= [Total Cost Measure], [Total Cost Measure], [Cumulative Total Alt] ) )


Incremental Alt =
CALCULATE( [Cumulative Max Alt], ALLSELECTED( 'Vulnerable Groups'[Vulnerable Groups] ) )
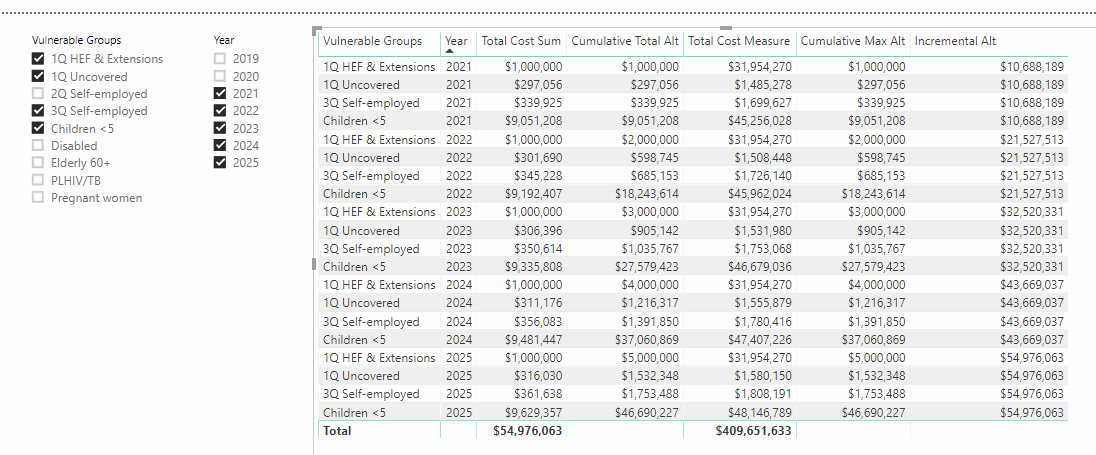
I believe this does it, and you’ll see that the formulas aren’t that difficult, it just takes making sure you have the correct iterating happening within formulas to make this work properly.
One this I don’t have it the totals, but you can easily add these using some IF( HASONEVALUE( …logic to add in the total. See how you go working through this based on the new formulas.
Model attached here
Cost Modeling 2.23.2019 TEST.pbix (264.4 KB)
Hello Sam,
Thanks so much for your work on this. I really appreciate it. The new formula you worked out is yielding the same result as the previous formula which is good. However, I am still not seeing that it is working to generate the correct sum total if I change the selection in the slicer.
I think the new formula is just summing all the previous year amounts and carrying those forward, even when those years are not selected.
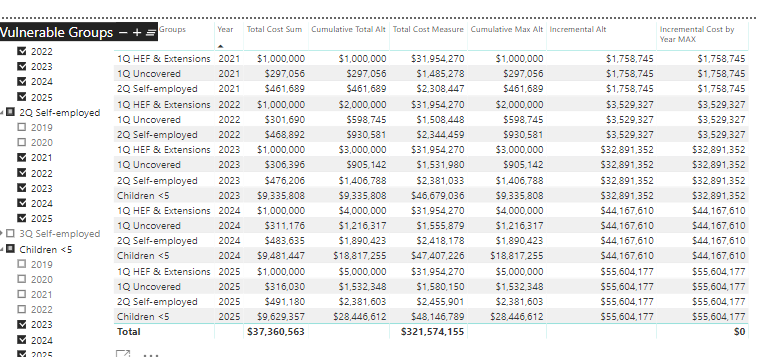
For example, when I select Children <5 starting in 2023 the Cumulative Max Alt values for 2025 are $5,000,000 + $1,580,150 + $2,455,901 + $28,466,612 = $37,360,563. However, the Incremental Total is calculating $55,604,177. Here is the table visual.
I am not sure if this is where the IF(HASONEVALUE) comes in. I have used the formula below, but get no noticeable effect.
Incremental Cost by Year MAX = IF(HASONEVALUE(‘Vulnerable Groups’[Vulnerable Groups]), [Incremental Alt], 0)
Thanks in advance for extra light you may be able to shed on for the final solution.
Kind regards,
Robert
Could this be to do with the custom visual??
I just changed it to two normal slicers and getting ok results no matter the selection, I believe…but I don’t know the data as well as you would.
Cost Modeling 2.23.2019 TEST.pbix (265.0 KB)
Thanks Sam,
Unfortunately, I need to be able to enable different year selection for each group. The final visualization I am looking for is just a stacked column chart with the total on top. I am completely puzzled as how Power BI can manage to make the individual group-year calculations for the stacked column chart, but it can’t correctly total those by year. It would seem like this should be basic… In any case, as it doesn’t seem possible, can you please recommend alternative software solutions that can manage this kind of calculation? Thanks, Robert
It’s seems like the exact requirement you have might not be able to be done. I wish I realised the full scenario myself before spending hours trying to work it out.
I personally stay away from custom visuals as they can cause a few issues, this being one of them. The DAX engine hasn’t been built (from my knowledge) to contend with the unlimited variations that some of these visual can create.
Regarding another platform that can do this. I’m not sure sorry. I haven’t really come across this problem myself and have been very Power BI focused for years now.
Chrs
Sam