Cumulative totals by date and time

Hello.

I created a report with data for energy price and generation for the company where I work. One of the measures I created is a YTD Revenue.

The issue is that when I open the YTD revenues by date and time, the totals stop making sense, as they increase and decrease by the hours. Have any of you people work in something similar?

Revenues 1.2.pbix (1.5 MB)

Hi @jtremaria, (version 2)

I made a work-around which works, creating a DAX-table and three measures, whereby all revenue figures are based upon the measure “Revenues”, which is based upon an average price x volume MWh.

For the outcome, you could have a look at “P1 Revenue per hour” for the results per day and hour and at " P1 Revenue per day " in attached PBIX, the second is used as a reference.

Revenues 1.6 DS.pbix (1.5 MB)

P.S. 1 Measures and DAX-table are based upon the Lookup tables Dates and Time, where-ever applicable.

P.S. 2 If you were looking for Revenue, based upon the price per hour x volume MWh per hour, the measure “Revenues” should be changed.
When looking at the revenue figures at “P1 Revenue per hour”, the individual lines of revenue in column “Revenues” are based upon hourly prices x hourly volume MWh, however the YTD and daily figures are price averaged. As a consequence the column “Revenues” cumulates differently comparing with the column “Hourly Site Cum.Revenue” ( The sum of Site Confluencia 01/01/2021 individual hour 0 and hour 1 revenue of 4.545 and 5.057 differs from the calculated hourly cum site revenue of 9.606)

If you have questions or remarks, please let me know.
I hope it helps you further.
Kind regards, deltaselect

==============
Workout in detail:

  1. created a table in DAX which calculates the revenue per site per day.
    A virtual table with AddColumns or Summarize for daily revenue did not work with me as the required context for revenue is too detailed, namely per hour.
    Used formula :
    DS Daily Site Revenue = SUMMARIZECOLUMNS( Dates[Date], Sites[Sites],"Site Revenue per day", [Revenues])

  2. Created three measures to come to the work-around YTD Total on hourly base.

     1 Daily Site Revenue = // daily revenue per site from the new table
     Var SiteRev = CALCULATE( SUM( 'DS Daily Site Revenue'[Site Revenue per day]), 
                 TREATAS( VALUES(Dates[Date]), 'DS Daily Site Revenue'[Date]), 
                 TREATAS( VALUES(Sites[Sites]), 'DS Daily Site Revenue'[Sites]))
     Return SiteRev
    
     2 Hourly Site Cum.Revenue = 
     var CumHourRevenue = CALCULATE( [DS Revenues], 
                             FILTER( ALLSELECTED('Time'[Hour]), 'Time'[Hour] <= MAX( 'Time'[Hour])))
     return CumHourRevenue
    
     3 YTD Site Total on hourly base = 
     var Year2 = YEAR(SELECTEDVALUE(Dates[Date])) //dynamically selects current year
     Var StartYear2 = DATE( Year2 , 1, 1 )
     Var Today2 = SELECTEDVALUE( Dates[Date])
     Var DaysintoYear2 = DATEDIFF(StartYear2, Today2, DAY)
     Var YTDYesterday2 = IF( DaysintoYear2 > 0,   //on the first day of the year, only cum hours revenue
                             CALCULATE( [Daily Site Revenue], DATESBETWEEN(Dates[Date], MAX(Dates[Date])-DaysintoYear2, max(Dates[Date])-1)),
                             0)
     return   // YTD Daily Site Revenue till last day + hourly cum revenue of the current day
     YTDYesterday2 +  [Hourly Site Cum.Revenue]  
    
  3. In order to get the right totals in Revenue, I adjusted your measure “Revenues” into “DS Revenues”

NOTE: The calculation in the measure “Revenues” is not changed !

 DS Revenues = SUMX( SUMMARIZE( Dates , Dates[Date] , "@Totals" , 
                                          [Generation] * [Price] ) ,   [@Totals] )

5 Likes

Wao. Fantastic work Jan.

I knew there was an issue with the formula for Revenues, but I still don’t fully understand the virtual table formulas like SUMMARIZE.

Thanks a lot.

Hi @jtremaria,

Is your question answered ?

Just some of my thoughts about Revenue, prices and volume.
Prices are defined at a very detailed level, as can be seen at table “Precios_21”, per Site per Date and per Hour. The same granularity is used for the volume, defined in “Generation”.
The price and volume table can possibly be integrated for a detailed revenue calculation per hour, because the two tables have the same granularity. An obvious important condition is that for every site, date and hour, there is the right price available.
Possible ways to integrate the tables in Power BI are MergeQueries in PowerQuery or Lookupvalue in DAX. With three dimensions involved, integration or making a lookup table is precise work !!

Maybe it is even possible to add the price to the source volume data, before it comes in PowerBI.
Or using an average price is best practice.

If you would be interested, I can send you a workout with DAX Lookup formulas.
Kind regards, deltaselect

Oh, that would be fantastic! I would really appreciate that. I honestly did think about merging these two queries, but I got some weird circular reference after creating a lookup table for sites and price nodes.

Now the I think about it, maybe I don’t even need a lookup table if I merge those two.

A heads up. We usually have more data for the generation than for price. Not sure why, but our market coordinator in Chile is always behind with the prices

Hi @jtremaria ,

Please receive hereby a workout with Lookupvalue, using DAX.

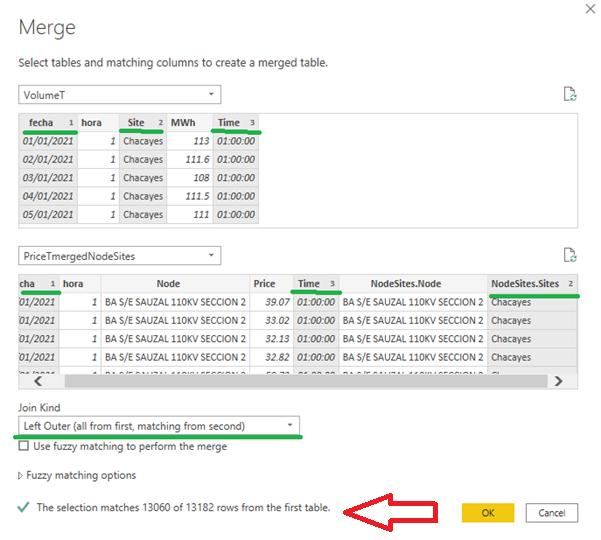
As mentioned before, be aware that for every site, every day and every hour, there has to be a price, otherwise no revenue is generated with the Lookup method ( as I set the alternate result from the lookup formula to 0), it needs a careful audit.

Steps for the Lookupvalue workout in DAX:

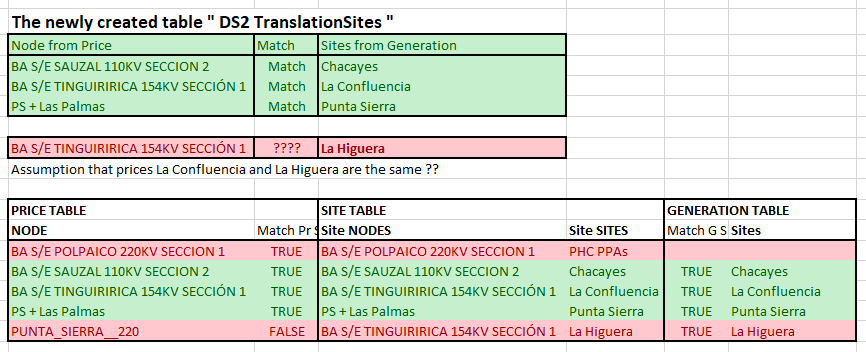
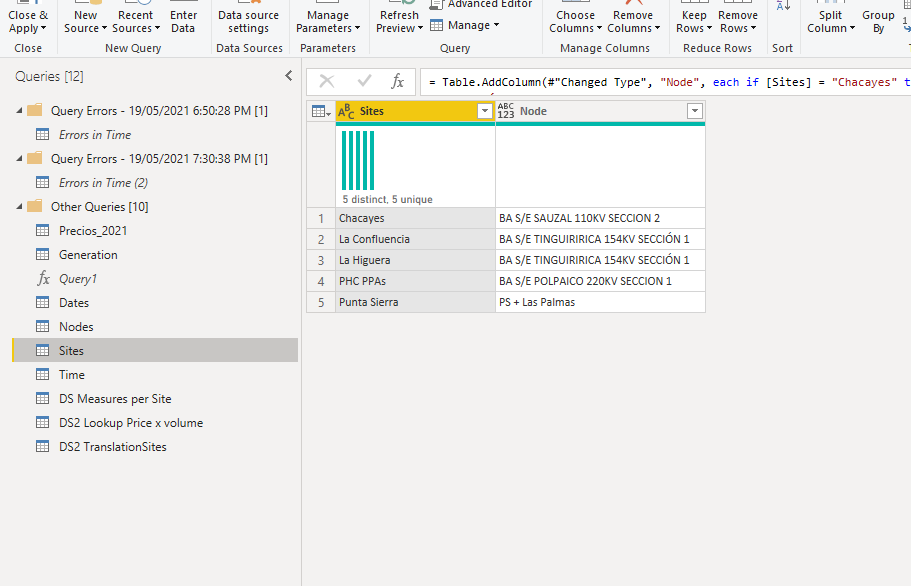
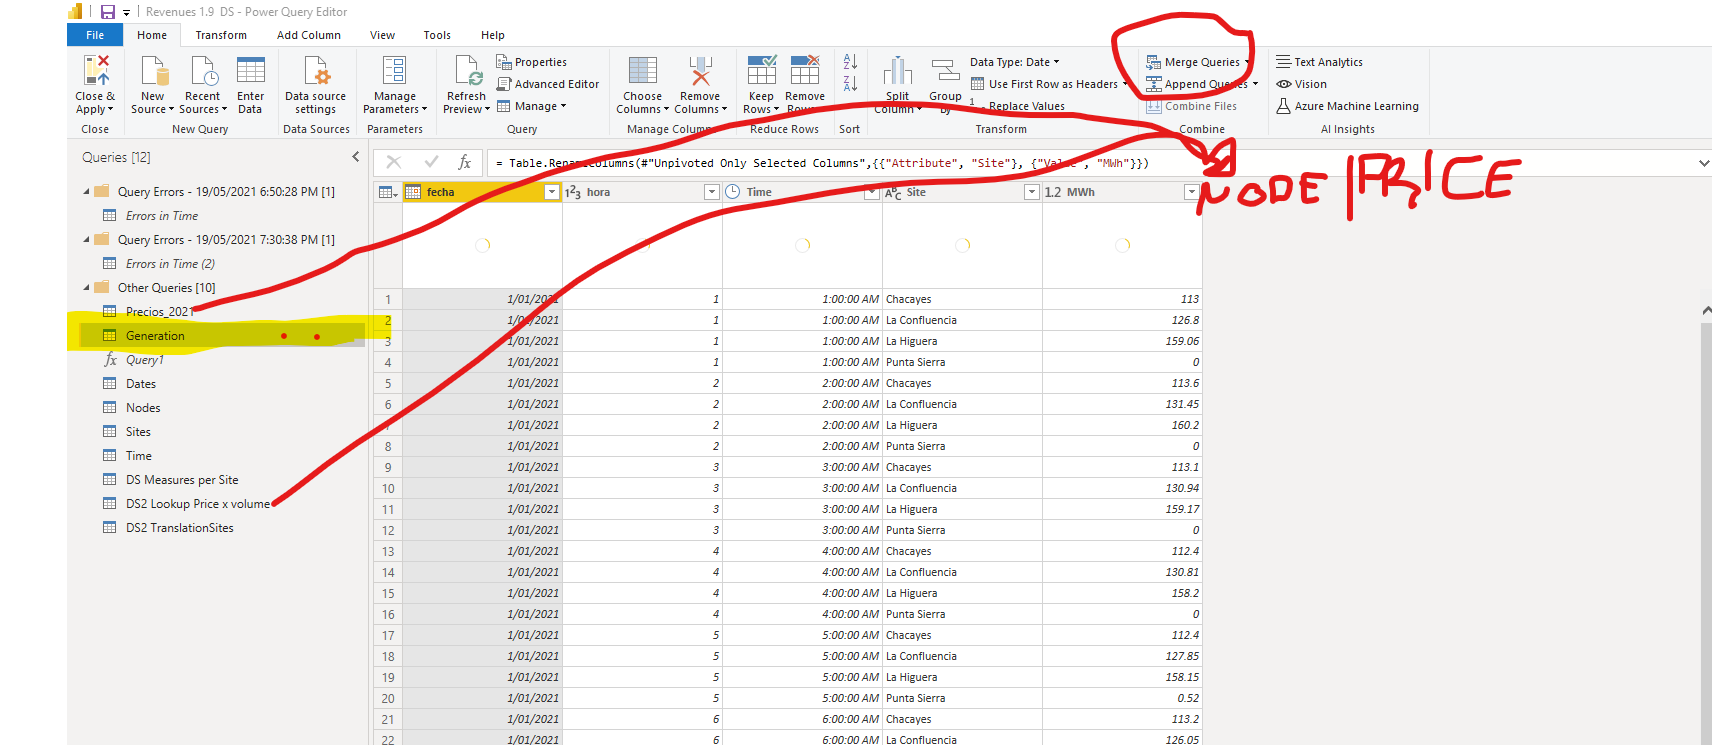
  1. create a translation table between Node (price table) and Site ( generation table)
  2. translate the node to a site in the price table (add a column, use Lookupvalue)
  3. create a unique key in the price table for every site, day and hour (add a column, use concatenate)
  4. create the same unique key in the Generation table
  5. add the price to the Generation table (add a column, use Lookupvalue)
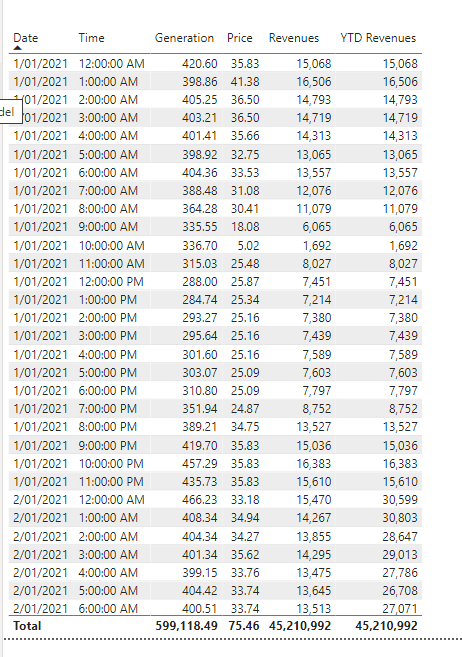
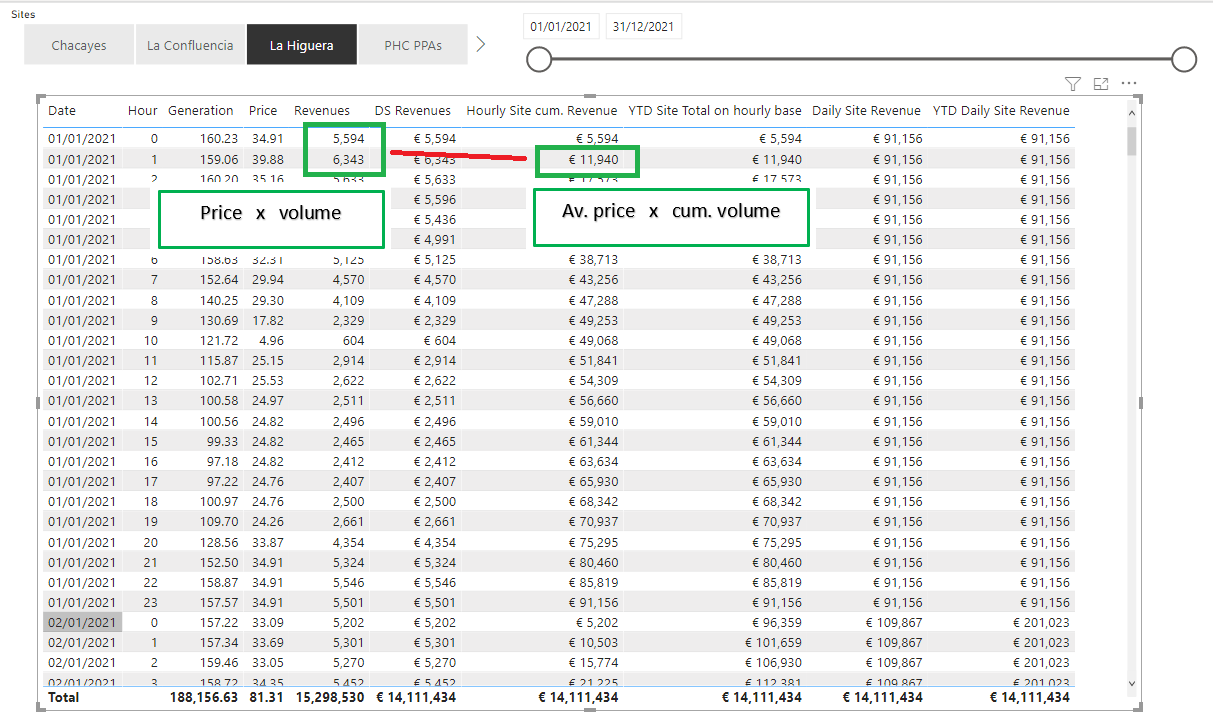
  6. create a measure Revenue from the Generation table (Sumx price x volume), “DS2 Revenue”

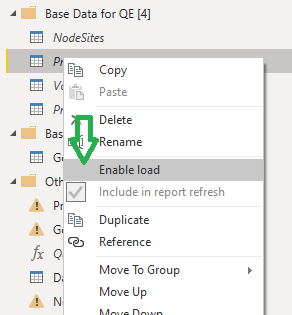
A new table “DS2 Daily Site Revenue” and an new measure group “DS2 Lookup Price x volume” is created, all based upon the renewed “DS2 Revenue” measure, for the renewed total calculations.

The previous total calculations remained for comparison reasons, the differences are not immense.

Two additional pages (two first pages) showing the two methods together are created in the report.
See the attached PBIX
Revenues 1.9 DS.pbix (1.8 MB)

There is no need for data relationships between tables searched and tables with the lookup value results, when using Lookupvalue.

P.S. I struggled with assigning Sites to Nodes, is it true that La Higuera and La Confluencia have the same prices, as both have the Node BA S/E TINGUIRIRICA 154KV SECCIĂ“N 1 ?
Within this workout, I assumed so, and the formula for generating the key at the Generation table is adjusted accordingly, modifying the key to “La Confluencia”, when the site is “La Higuera”, have a look at the formula in the column “Keygeneration” . (not a fan of this kind of adjustments, but it could work well)

If you have further questions or remarks, please let me know.
Kind regards, Jan van der Wind

2 Likes

Amazing. You make it look easy!

Your assumption was right about La Higuera and la Confuencia using the same price node (which is determined by the power plant’s location). In the case of PHC PPAs, is it a kind of a contract without actually generating energy.

I actually created a similar lookup table but got stock with the merge. I should have asked for your help before, lol.

Do you think I should actually merge the Generation table with the Price one (Precios_2021) in the query editor?

This was my attempt at a lookup table:

And I guess this is what I could do if merging is a good idea?

I think I will start the report from scratch later this year because the system coordination will update its system to make it easier to make direct queries, instead of using an intermediary Excel as I do now. So I would copy the best practices I am learning here.

My full project will include including a forecast of price and generation to estimate the revenues for the full month.

Hi @jtremaria ,

LookupValue is not that difficult,. however, I must admit (as I like DAX formulas) that the merge method is much easier :grinning:
After implementing the merge queries, no differences were found, comparing the two methods (!), the only difference of 24.171 was found on hora 24 and 25 at April 3, this needs further investigation.
Two additional measures ( revenue and variance) were created, in measure group “DS3 Merge Measure” and 2 additional report pages with (no) variances.
See also attached renewed PBIX
Revenues 1.11 DS.pbix (1.9 MB)

Not sure where you faced a problem with the merge, therefore a workout of the merge:

  1. create a lookup table of the required node for all existing sites in the Generation table
  2. merge the price table with the site/node table, select Home–>Merge Queries as New, merge on “Node”, available as a column on both sides, use Left Outer Join (default) and Expand the Table column in the combined new query, the column “Site” is added to the price table .
    ==> Before pressing on “OK”, please check how many rows are matched, it gives a good indication if something significantly is not matched ( see also Red Arrow in picture below)
  3. merge Generation Table with the new enriched Price table, new query, select columns on both sides in the right sequence (1,2,3) fecha, Siter/NodeSites.Sites and Time, this creates a new enriched query with volume MWh and Prices, (see for the column selection below).
  4. Upload only the latest query, no need to upload the base Fakt tables in PowerBi, to reduce the load to the data model ( untick “Enable Load”, right mouse click on a query, see below)
  5. With the enriched Generation table, the data model could be simplified, with only relationships from the fact table to the date, time and site tables.
  6. To make sure to avoid any chance on ambiguity /circular references, the Node/Site table in the data model should not be created with a query from the fact tables, which are also used in the data model. Not sure if ambiguity is an issue when generating Merge queries. (I used for the merge process a uploaded Node/Site table)

unload

Course Merging Query

Nice project(s) laying ahead for you !

Kind regards, Jan van der Wind

1 Like

Hi @Jtremaria

I hope that you are having a great experience using the Support Forum so far. Kindly take time to answer the Enterprise DNA Forum User Experience Survey, we hope you’ll give your insights on how we can further improve the Support forum. Thanks!

1 Like

Hi @jtremaria, did the response provided by @deltaselect help solve your query? If not, how far did you get and what kind of help you need further? If yes, kindly mark as solution the answer that solved your query. Thanks!

Hi @jtremaria, we’ve noticed that no response has been received from you since the 27th of May. We just want to check if you still need further help with this post? In case there won’t be any activity on it in the next few days, we’ll be tagging this post as Solved.

Hi @jtremaria, due to inactivity, a response on this post has been tagged as “Solution”. If you have a follow question or concern related to this topic, please remove the Solution tag first by clicking the three dots beside Reply and then untick the check box.

Kindly take time to answer the Enterprise DNA Forum User Experience Survey, we hope you’ll give your insights on how we can further improve the Support forum. Thanks!

Done!

Again, excellent work.

You are welcome, thanks for the compliments!
Feel free to use the forum in the future.