Hi everyone,
I am fairly new to DAX so have a feeling I might just be using the wrong DAX for the job as such.
I am attempting to create a measure that would show a predicted stock position - taking away a daily sales average and adding any new stock arriving. Due to the number of SKUs in the final model (200+) I shied away from trying this in calculated columns as I feel it would bloat the model. To aid me create the measure I made a simpler version of the model Test for stock graph.pbix (217.4 KB) with only 3 SKUs.
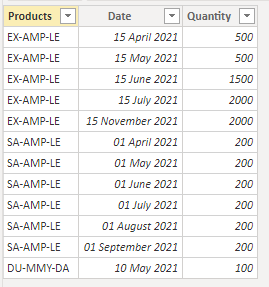
Inbound Shipments
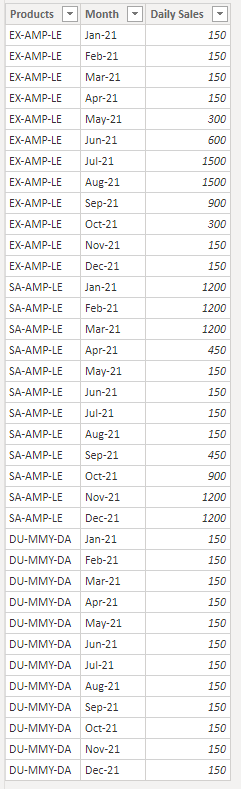
Monthly Sales
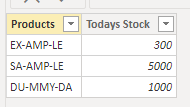
Stock Today
I have attempted to create a virtual table using AddColumns to take the Date from the Date table and then in the second columns “Sales Velocity” - get the daily average sales for each month getting taken away each day and then inbound shipments being added. See DAX below
    ADDCOLUMNS( Values('Dates Table'[Date]),
"Sales Velocity", [Inbound Shipments] - IF('Dates Table'[Date] >= DATE(2021,01,01) && 'Dates Table'[Date] <= DATE(2021,01,31),[January Sales V],
                  IF('Dates Table'[Date] >= DATE(2021,02,01) && 'Dates Table'[Date] <= DATE(2021,02,28),[February Sales V],
                  IF('Dates Table'[Date] >= DATE(2021,03,01) && 'Dates Table'[Date]<= DATE(2021,03,31),[March Sales V],
                  IF('Dates Table'[Date] >= DATE(2021,04,01) && 'Dates Table'[Date] <= DATE(2021,04,30),[April Sales V],
                  IF('Dates Table'[Date] >= DATE(2021,05,01) && 'Dates Table'[Date] <= DATE(2021,05,31),[May Sales V],
                  IF('Dates Table'[Date] >= DATE(2021,06,01) && 'Dates Table'[Date] <= DATE(2021,06,30),[June Sales V],
                  IF('Dates Table'[Date] >= DATE(2021,07,01) && 'Dates Table'[Date] <= DATE(2021,07,31),[July Sales V],
                  IF('Dates Table'[Date] >= DATE(2021,08,01) && 'Dates Table'[Date] <= DATE(2021,08,30),[August Sales V],
                  IF('Dates Table'[Date] >= DATE(2021,09,01) && 'Dates Table'[Date] <= DATE(2021,09,30),[September Sales V],
                  IF('Dates Table'[Date] >= DATE(2021,10,01) && 'Dates Table'[Date] <= DATE(2021,10,31), [October Sales V],
                  IF('Dates Table'[Date] >= DATE(2021,11,01) && 'Dates Table'[Date] <= DATE(2021,11,30),[November Sales V],
                  IF('Dates Table'[Date] >= DATE(2021,12,01) && 'Dates Table'[Date] <= DATE(2021,12,31),[December Sales V],0)))))))))))))
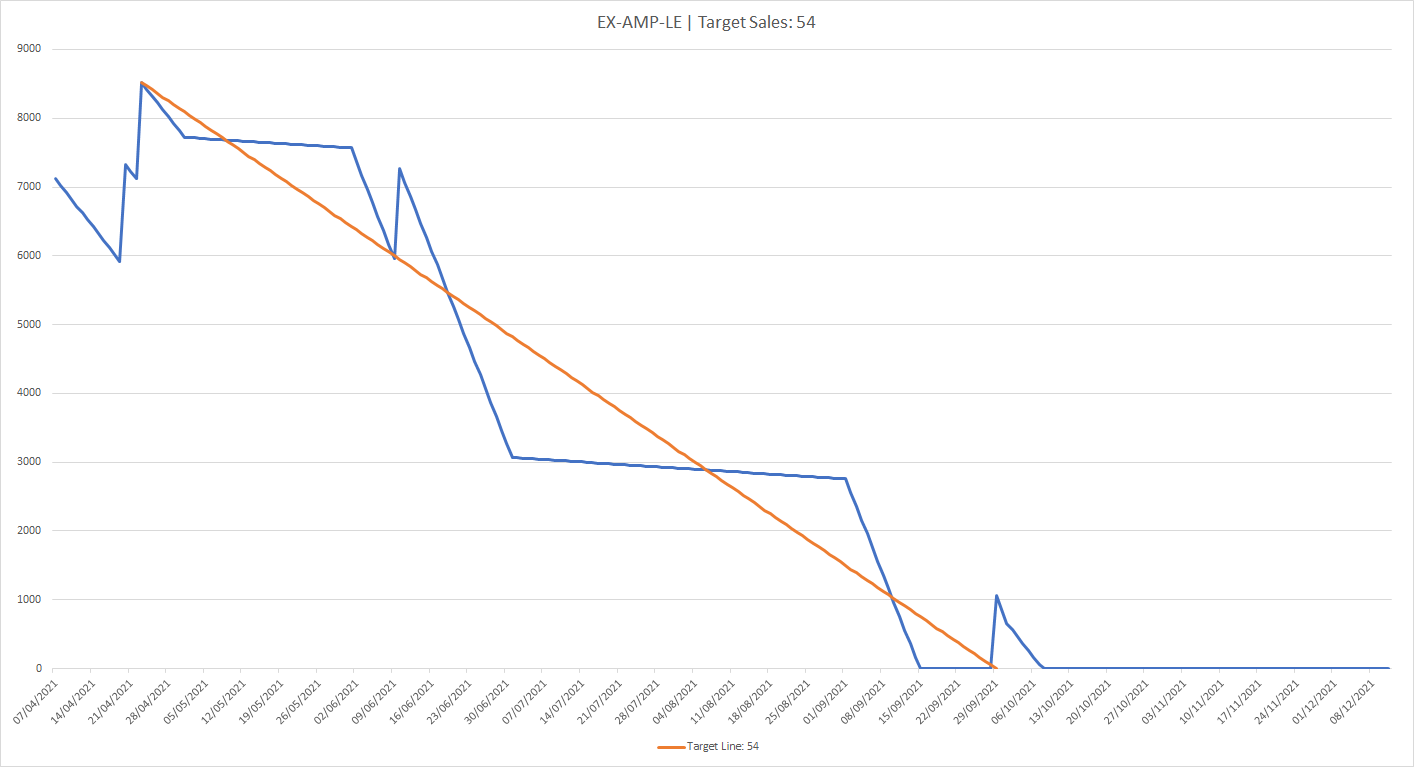
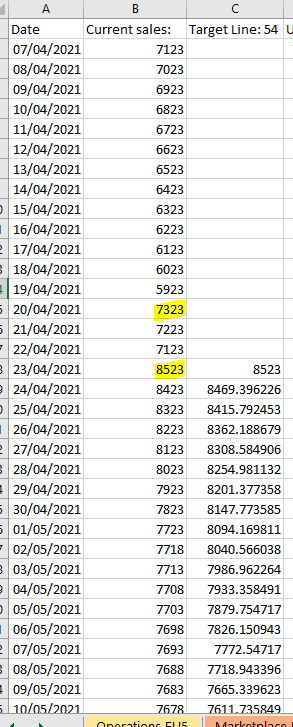
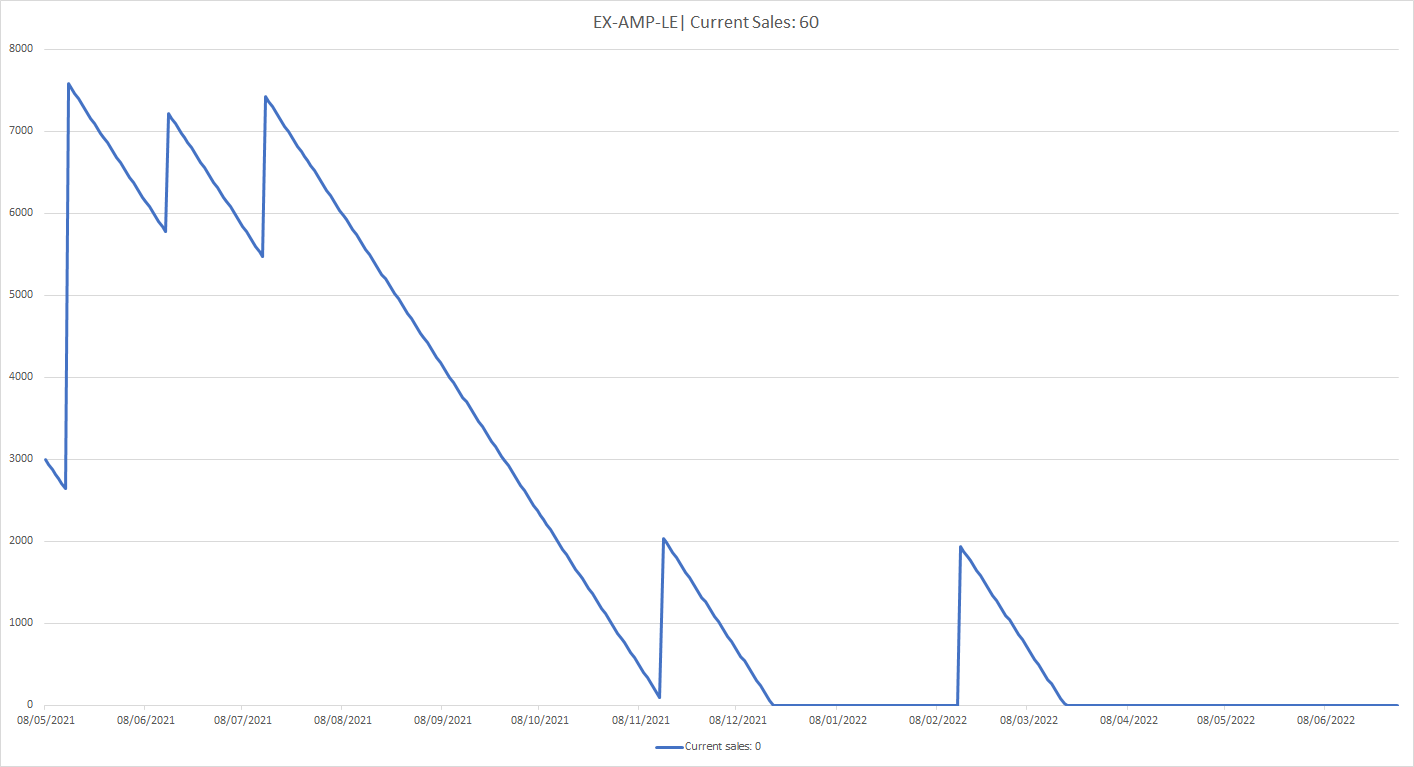
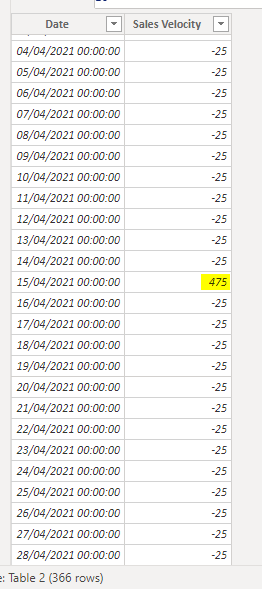
That gives be the subsequent table (when I put it into a table not a measure to visualise what’s going on), this appears to do what I’m after although I feel as though there is probably a more elegant way.
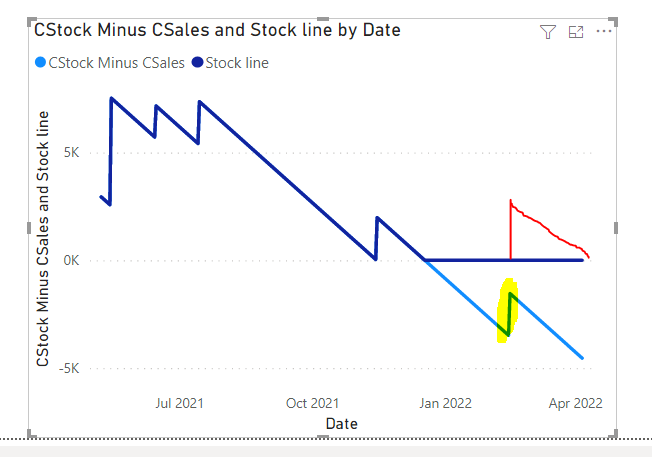
So finally I have tried to apply a cumulative total over the virtual table. The hope was that I could then take the Stock level today - the cumulative total which would produce a graph of a stock level depleting and then going back up when the next inbound shipment arrived.
  Test v2 =
VAR VirtualTable =
ADDCOLUMNS( Values('Dates Table'[Date]),
"Sales Velocity", [Inbound Shipments] - IF('Dates Table'[Date] >= DATE(2021,01,01) && 'Dates Table'[Date] <= DATE(2021,01,31),[January Sales V],
                  IF('Dates Table'[Date] >= DATE(2021,02,01) && 'Dates Table'[Date] <= DATE(2021,02,28),[February Sales V],
                  IF('Dates Table'[Date] >= DATE(2021,03,01) && 'Dates Table'[Date]<= DATE(2021,03,31),[March Sales V],
                  IF('Dates Table'[Date] >= DATE(2021,04,01) && 'Dates Table'[Date] <= DATE(2021,04,30),[April Sales V],
                  IF('Dates Table'[Date] >= DATE(2021,05,01) && 'Dates Table'[Date] <= DATE(2021,05,31),[May Sales V],
                  IF('Dates Table'[Date] >= DATE(2021,06,01) && 'Dates Table'[Date] <= DATE(2021,06,30),[June Sales V],
                  IF('Dates Table'[Date] >= DATE(2021,07,01) && 'Dates Table'[Date] <= DATE(2021,07,31),[July Sales V],
                  IF('Dates Table'[Date] >= DATE(2021,08,01) && 'Dates Table'[Date] <= DATE(2021,08,30),[August Sales V],
                  IF('Dates Table'[Date] >= DATE(2021,09,01) && 'Dates Table'[Date] <= DATE(2021,09,30),[September Sales V],
                  IF('Dates Table'[Date] >= DATE(2021,10,01) && 'Dates Table'[Date] <= DATE(2021,10,31), [October Sales V],
                  IF('Dates Table'[Date] >= DATE(2021,11,01) && 'Dates Table'[Date] <= DATE(2021,11,30),[November Sales V],
                  IF('Dates Table'[Date] >= DATE(2021,12,01) && 'Dates Table'[Date] <= DATE(2021,12,31),[December Sales V],0)))))))))))))
VAR X = CALCULATE(VirtualTable,
            FILTER('Dates Table',
            'Dates Table'[Date] <= MAX('Dates Table'[Date])))

Return X
However, I keep getting errors - “The expression refers to multiple columns. Multiple columns cannot be converted to a scalar value.”
Any and all help would be greatly appreciated!