I know I have seen the solution and just can’t seem to find where it was…
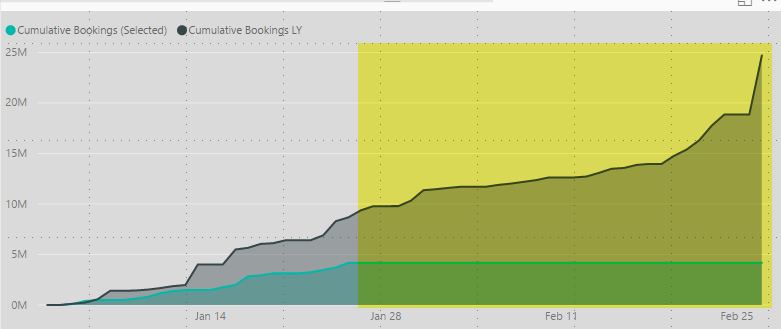
I have a measure for my cumulative totals:
Cumulative Total (Selected) =
CALCULATE(
	'Total Sales',
	FILTER(
		ALLSELECTED(Dates),
		Dates[Date] <= MAX( Dates[Date])
	)
)
I create another measure for the cumulative totals last year. I have my date table set and add an area chart to my canvas. Chart has the Date as the axis and all looks good, except when I filter results by year and select 2018. Since we have data for all of 2017, the LY measure sets the axis to go to its end, as opposed to the current total end. I need to set this so when 2018 is selected, it only displays out as far as the current year MAX date for totals