Cumulative total using an inactive relationship

Hi all,

I am trying to calculate a cumulative total using an inactive date relationship. I can calculate a simple sum total using USERELATIONSHIP without any issue but something has gone wrong with the cumulative total DAX syntax.

The reason for using an inactive relationship is that I later want to use a SWITCH and SELECTEDVALUE measure with a date slicer. First I need to figure out what’s up with the cumulative total calculation.

Here’s the DAX code for the sum calculation using an inactive date relationship, this works ok.

Sum Values - Inactive Relationship = 
CALCULATE(
    SUM('Table'[Value]),
    USERELATIONSHIP('Table'[End of Quarter], 'Calendar'[Date])
)

And here is the DAX for the cumulative total using the same using inactive date relationship, this doesn’t produce the intended result.

Cumulative Values - Inactive Relationship = 
CALCULATE(
    SUM('Table'[Value]),
    USERELATIONSHIP('Table'[End of Quarter], 'Calendar'[Date]),
    FILTER(
        ALLSELECTED('Calendar'[Date]),
        ISONORAFTER('Calendar'[Date], MAX('Calendar'[Date]), DESC)
    )
)

The result I am expecting for the inactive relationship is the same as for the active relationship when using the Calendar[End of Quarter] date column.

Here is a PBIX file with a simplified version of my data and model.

InactiveRelationship.pbix (88.5 KB)

Thanks for reading and hope you can help!
Eddie

Hello @AsMoBhosca,

Thank You for posting your query onto the Forum.

Below is the screenshot as well as formula provided for the reference to achieve the desired result that you’ve been looking for.

Cumulative Values - Inactive Relationship - Harsh = 
CALCULATE( SUM( 'Table'[Value] ) , 
    FILTER( ALLSELECTED( 'Calendar'[Date] ) , 
        'Calendar'[Date] <= MAX( 'Calendar'[Date] ) ) , 
    USERELATIONSHIP( 'Table'[Date] , 'Calendar'[Date] ) ) 

Also attaching the PBIX file for the reference.

Hoping this meets your requirements that you’ve been looking for. :slightly_smiling_face:

Thanks and Warm Regards,
Harsh

InactiveRelationship - Harsh.pbix (76.0 KB)

Thanks for the quick response Harsh but your solution is not quite what I’m looking for.

I want to use the ‘Calendar’[Date] as the X-Axis on the graph but there should only be three columns, one for each quarter as per the the Sum Values - Inactive Relationship by Date graph and also the Cumulative Values - Active Relationship graph (note the Axis on this graph uses the ‘Calendar’[End of Quarter] date column).

In your solution for the Inactive Relationship graph there is a column for each data point rather than a cumulative sum for each quarter, it seems the USERELATIONSHIP has not selected the correct inactive relationship, same issue I had.

Hello @AsMoBhosca,

The chart which is on the left side of my graph use the “Date” as a data point and therefore I selected the same data point in my solution. But you can change the data point from “Date” to “End Of Quarter” from the date table and then you can have only 3 data points pertaining to each quarter. Below is the screenshot provided for the reference -

Thanks and Warm Regards,
Harsh

InactiveRelationship - Harsh v2.pbix (81.5 KB)

1 Like

Thanks again Harsh but it’s still not the correct solution for me.

The “Sum Values - Inactive Relationship” graph uses the ‘Calendar’[Date] column of the Axis but USERELATIONSHIP switches from the active ‘Calendar’[Date] to the inactive ‘Table’[End of Quarter] relationship.

The solution I am looking for is for the Cumulative Values - Inactive Relationship graph to to use the ‘Calendar’[Date] as the axis but should only have three columns of data, as per the Cumulative Values - Active Relationship graph.

In your measure for USERELATIONSHIP you used USERELATIONSHIP( 'Table'[**Date**] , 'Calendar'[Date] ) where as I want to utilise the 'Table'[**End of Quarter**] column.

Note what happens in your solution when the Axis is manually changed on the visual changed from ‘Calendar’[End of Quarter] to ‘Calendar’[Date].

Thanks for helping and hope I’ve now made myself clear.

Hello @AsMoBhosca,

Firstly, let me point out to a fact that what you’re trying to achieve is not feasible because you’ve a bi-directional filter on in your data model which is absolutely not recommended and just by replacing the field from “Table[Date]” to “Table[End Of Quarter]” won’t provide you the results for that you need to replace the field into the visual itself.

When I removed the bi-directional filters from your model it provided the correct results for “Cumulative Values - Inactive Relationship”.

Below are the screenshots provided for the reference step-by-step:

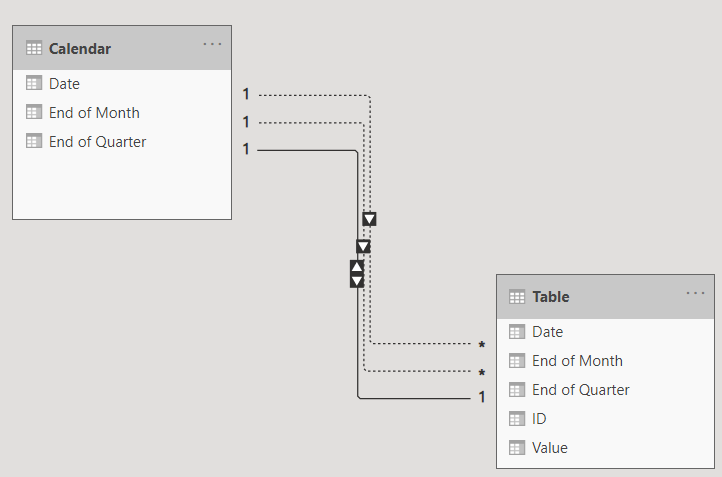
  1. Bi-directional Filters in your data model -

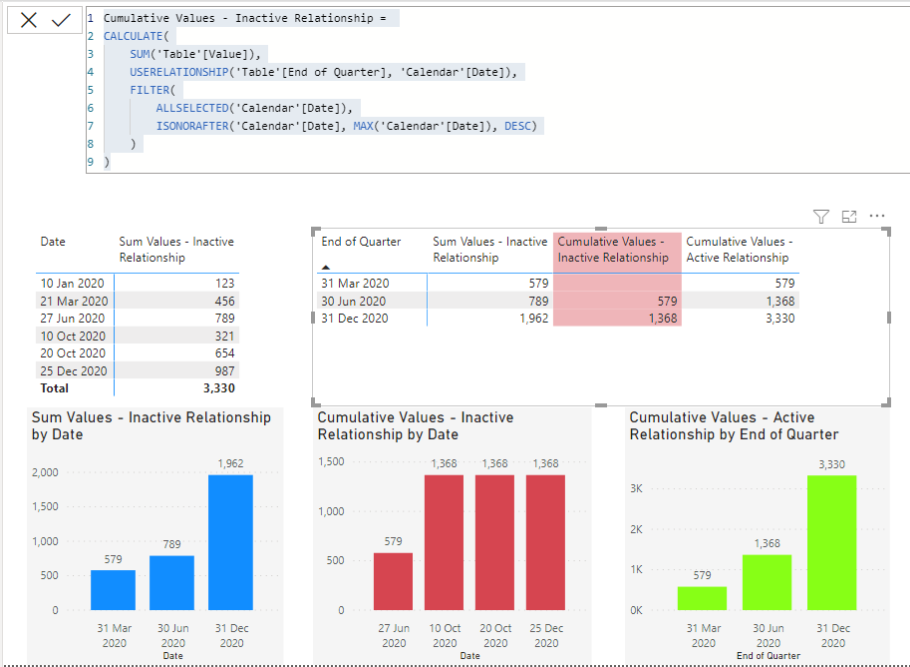
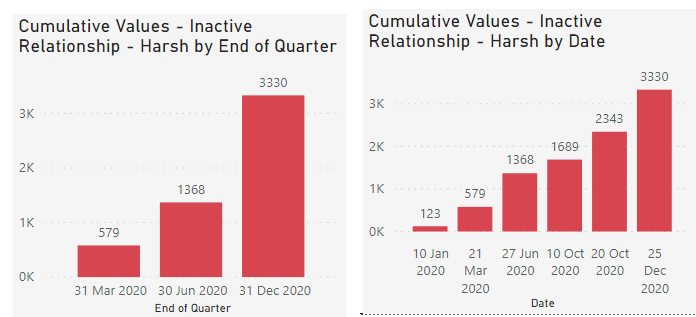
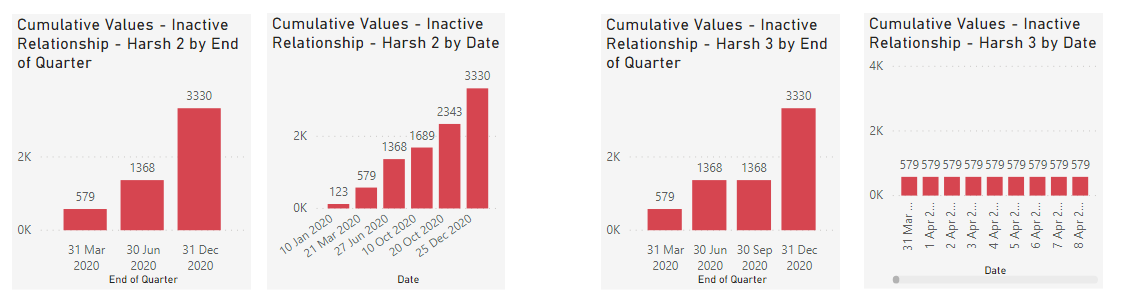
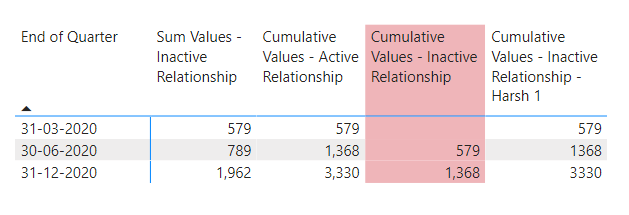
  1. Due to Bi-directional Filters your results were incorrect -

Step 2

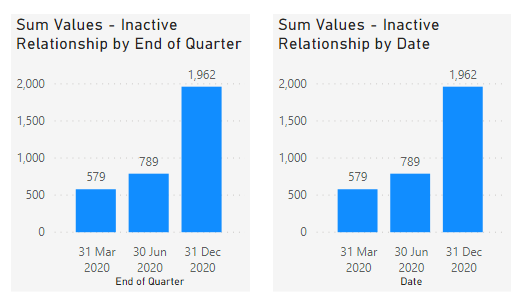
  1. Remove the Bi-directional Filters from the data model -

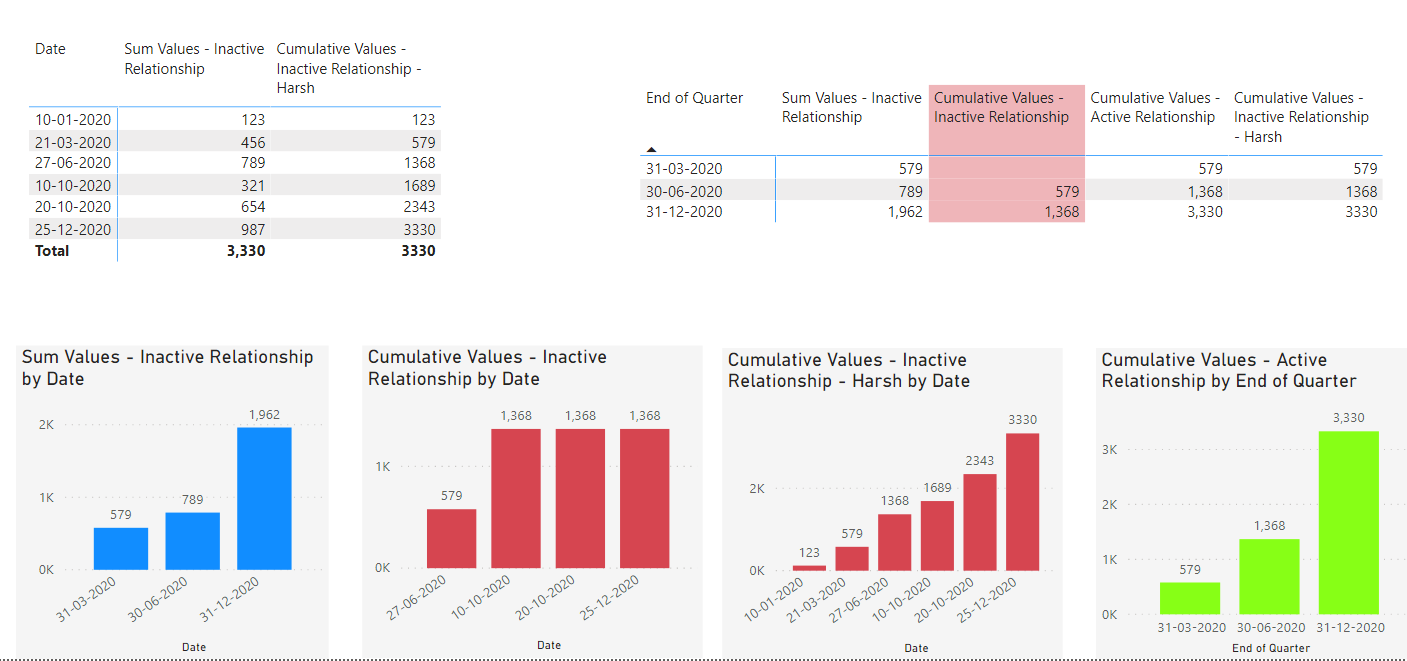
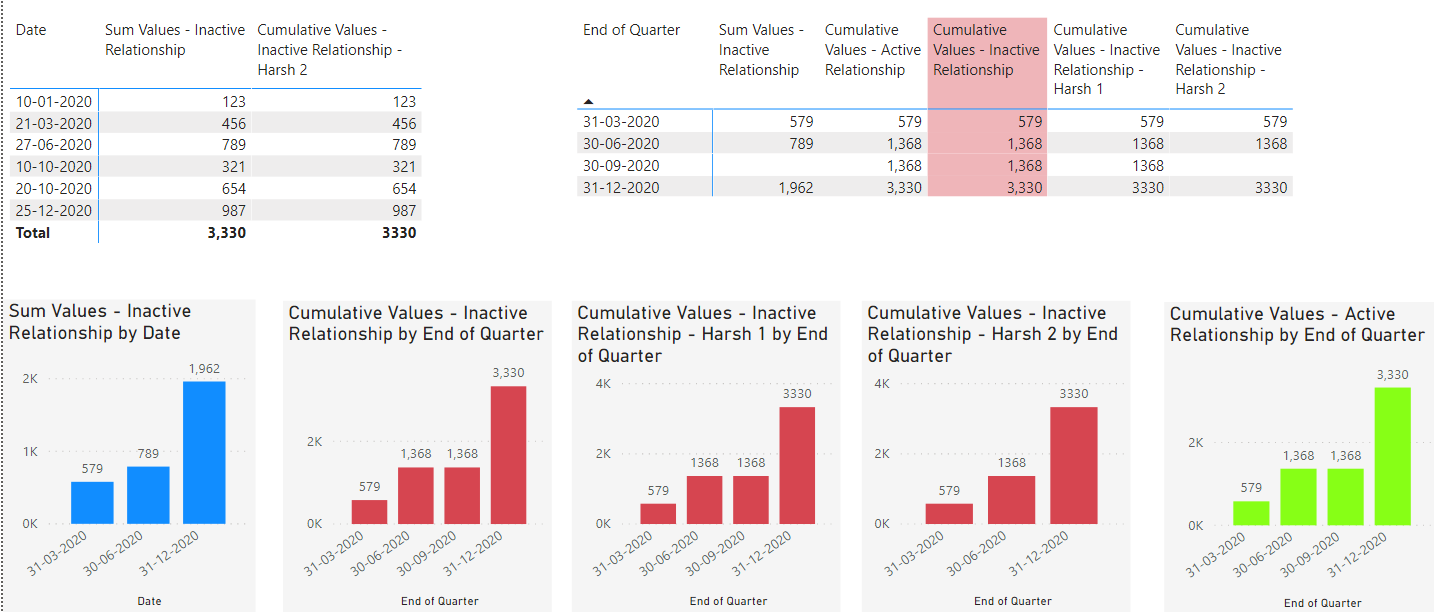
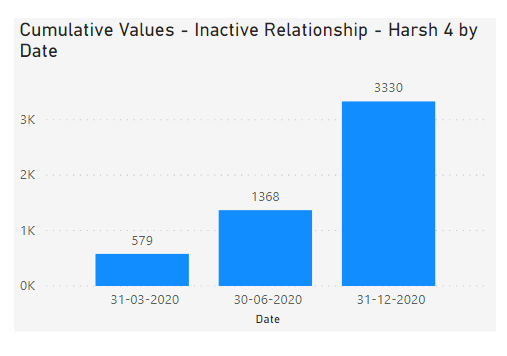
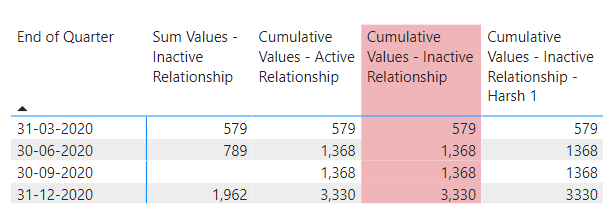
  1. Correct results were obtained after removing the Bi-directional filters. Identical to my results -

Step 4

On top of all these you hadn’t marked your date field as a “Date Table” which led to ambiguous results.

Also when you posted your second post it was very clear that you wanted the 3 data points only and therefore, I changed the field into the visual from “Calendar[Date]” to “Calendar[End of Quarter]”. Just by placing the field into the “Formula” itself one cannot derive that many data points into the visual. We need to place that particular field into the visual in order to derive/or have that many data points in it.

I hope now I’ve made my points clear that why I’ve replaced the field into the visual to have 3 data points. And therefore for different data points different fields need to be inserted as I’ve done in my case.

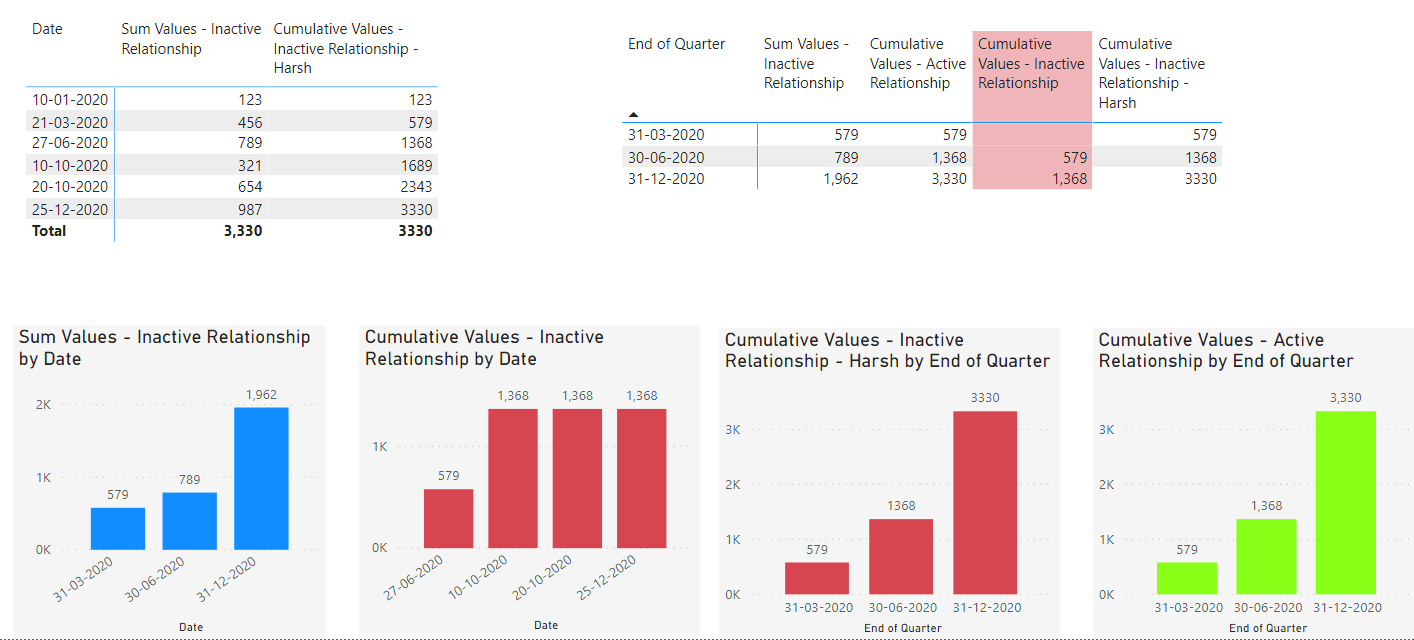
Lastly, before I sign off from this post. I would also like to highlight that as you can see that in the table provided above that once you change the filter propogations into the data model it repeats the total from the previous quarter. Now, if you don’t want to have that kind of results into your table you can write the formula as provided below -

Sum Values - Inactive Relationship - Harsh 1 = 
CALCULATE( SUM( 'Table'[Value] ) ,
    USERELATIONSHIP( 'Table'[Date] , 'Calendar'[Date] ) )

Cumulative Values - Inactive Relationship - Harsh 2 = 
VAR CumulativeValues = 
CALCULATE( [Sum Values - Inactive Relationship - Harsh 1] ,  
    FILTER( ALLSELECTED( 'Calendar'[Date] ) , 
        'Calendar'[Date] <= MAX( 'Calendar'[Date] ) ) )

RETURN
IF( ISBLANK( [Sum Values - Inactive Relationship - Harsh 1] ) , 
    BLANK() ,
    CumulativeValues )

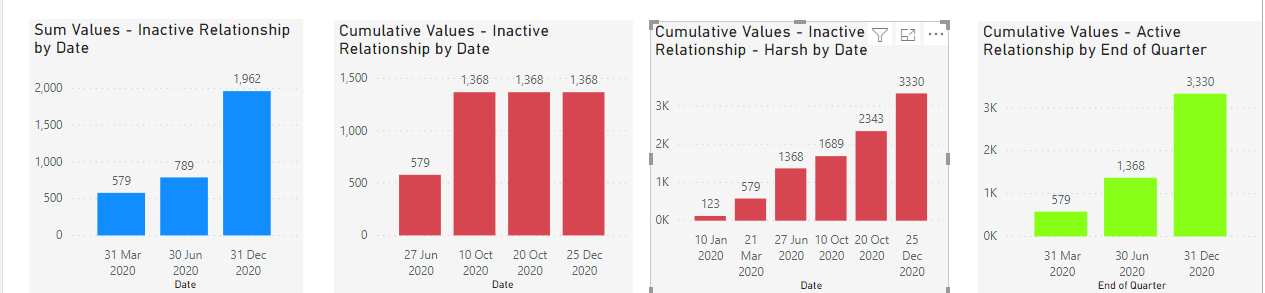
And then the result will be like this as per the screenshot provided below -

Important Note: Also I’ve observed in your formulas that you’ve used “USERELATIONSHIP” function multiple times. I would like to highlight that you just need to use “USERELATIONSHIP” or “TREATAS” functions only once while writing the primary formulas and from there on the measure branching technique will automatically take care off of the remaining secondary formulas that you write.

Hoping that this explanation makes it clear from my side and helps you to achieve the results what you’re looking for. :slightly_smiling_face:

Also attaching the final working of the PBIX file for the reference.

Thanks and Warm Regards,
Harsh

InactiveRelationship - Harsh Final Version.pbix (76.2 KB)

4 Likes

Hi @Asmobhosca, did the response provided by @Harsh help you solve your query? If not, how far did you get and what kind of help you need further? If yes, kindly mark the thread as solved. Thanks!

Hi Harsh,

Thanks again for a very detailed post and spotting the issue with the bi-directional filter and date table.

Unfortunately I have to repeat again that your solution is not the end result what I was hoping to achieve. Perhaps it’s not even possible.

In my original post, this sum calculation utilises USERELATIONSHIP to specify the Inactive relationship between ‘Table’[End of Quarter] and ‘Calendar’[Date]

Sum Values - Inactive Relationship = 
CALCULATE(
    SUM('Table'[Value]),
    USERELATIONSHIP('Table'[End of Quarter], 'Calendar'[Date])
)

As per the screengrab below whether I use ‘Calendar’[Date] or ‘Calendar’[End of Quarter] for the X-Axis in the visual I get a column for each quarter with data.

InactiveRelationshipSum

As per the non-cumulative sum I want the graph for the cumulative sum to use ‘Calendar’[Date] on the Axis. I know I can achieve the desired look using ‘Calendar’[End of Quarter] as per your solution but that achieves the same result as using the Active relationship - I want to use the Inactive relationship.

With your solutions, the visuals correctly display either 3 or 4 columns of columns when ‘Calendar’[End of Quarter] is used on the X-Axis but I want to use ‘Calendar’[Date].

Is it even possible to create a DAX calculation that uses an Inactive relationship for a Cumulative Sum?

I really appreciate your time taken to respond so far, apologies for the confusion in my previous explanations.

InactiveRelationship (4).pbix (78.1 KB)

Hello @AsMoBhosca,

I guess this formula should meet your requirement that you’re looking for. Below are the formulas as well as the screenshot of the result provided for the reference below -

Sum Values - Inactive Relationship - Harsh 2 = 
CALCULATE(
    SUM('Table'[Value]),
    USERELATIONSHIP('Table'[End of Quarter], 'Calendar'[Date])
)


Cumulative Values - Inactive Relationship - Harsh 4 = 
VAR CumulativeValues = 
CALCULATE( [Sum Values - Inactive Relationship - Harsh 2] ,  
    FILTER( ALLSELECTED( 'Calendar' ) , 
        'Calendar'[End of Quarter] <= MAX( 'Calendar'[End of Quarter] ) ) )

RETURN
IF( ISBLANK( [Sum Values - Inactive Relationship - Harsh 2] ) , 
    BLANK() ,
    CumulativeValues )

Resultant Output

I’m also attaching the working of the PBIX file for the reference.

Hoping this will meet your requirements that you’ve been looking for. :slightly_smiling_face:

Thanks and Warm Regards,
Harsh

InactiveRelationship - Harsh.pbix (77.1 KB)

Hi @Asmobhosca, did the response provided by @Harsh help you solve your query? If not, how far did you get and what kind of help you need further? If yes, kindly mark the thread as solved. Thanks!

Wohoo! Yes this is it. Thanks so much Harsh.

Hello @AsMoBhosca,

You’re Welcome. :slightly_smiling_face:

I’m really glad that I was able to assist you and you found the solution useful and it met your requirements.

Thanks and Warm Regards,
Harsh