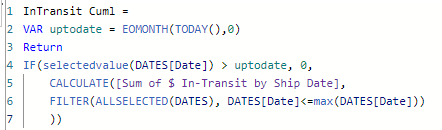
I’m sure I’m doing something dumb, but I’m stumped. I’m trying to calculate cumulative shipments up to this month.
I’m following the logic Sam presented here:
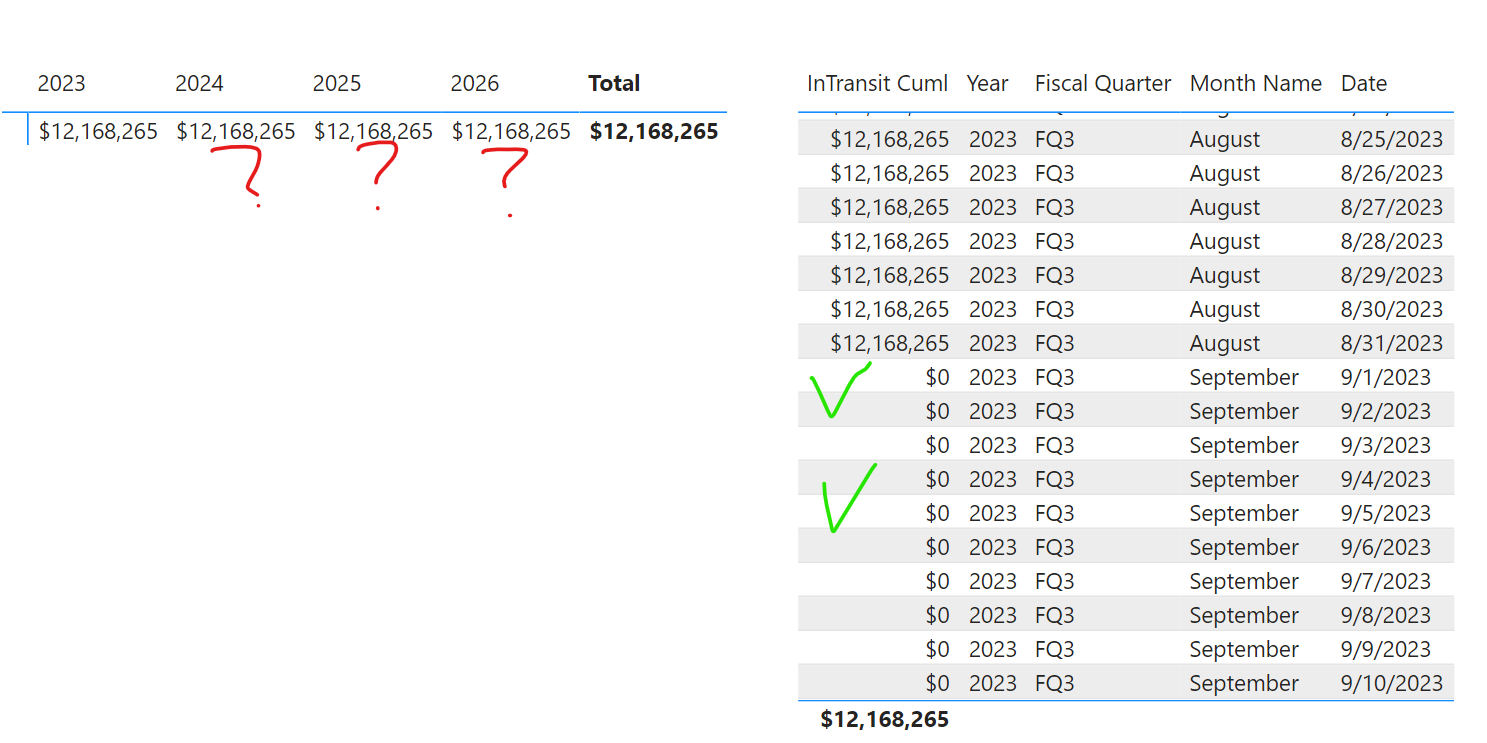
The table data looks like its working correctly, but then when I put into a matrix visual it just carries the values to the end. (showing zero in example, but I also tried blank())
Hi @HufferD ,
Most of the measure broke in this sample and the values are different than the screenshot, but shows the issue that I’m getting a line straight across in a chart and the matrix visual presents all the same value even thought the dax calculation seems to be working correctly. I’m trying to accomplish what Sam shows in the video, but not getting the same result sample.pbix (709.9 KB)
Without having seen the video it’s difficult to know where your problems are. I know he describes calculating a cumulative total only up to a specific point so that actuals are shown without an extended, flat line mapping onto the dates of forecasted data.
Is there a specific measure in your .pbix that you are wanting to work with?
Hi @HufferD -
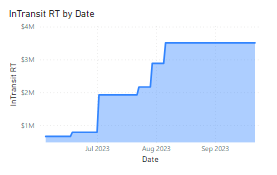
What I’m trying to accomplish is in a matrix visual or a graph that the cumulative in-transit shows the value so far up to this month, but then is blank after this month (since it hasn’t happened yet).
Sam effectively does this in the instruction video and the graph stops up to a certain point. (I’ve attached the second screenshot copied from the article for reference).
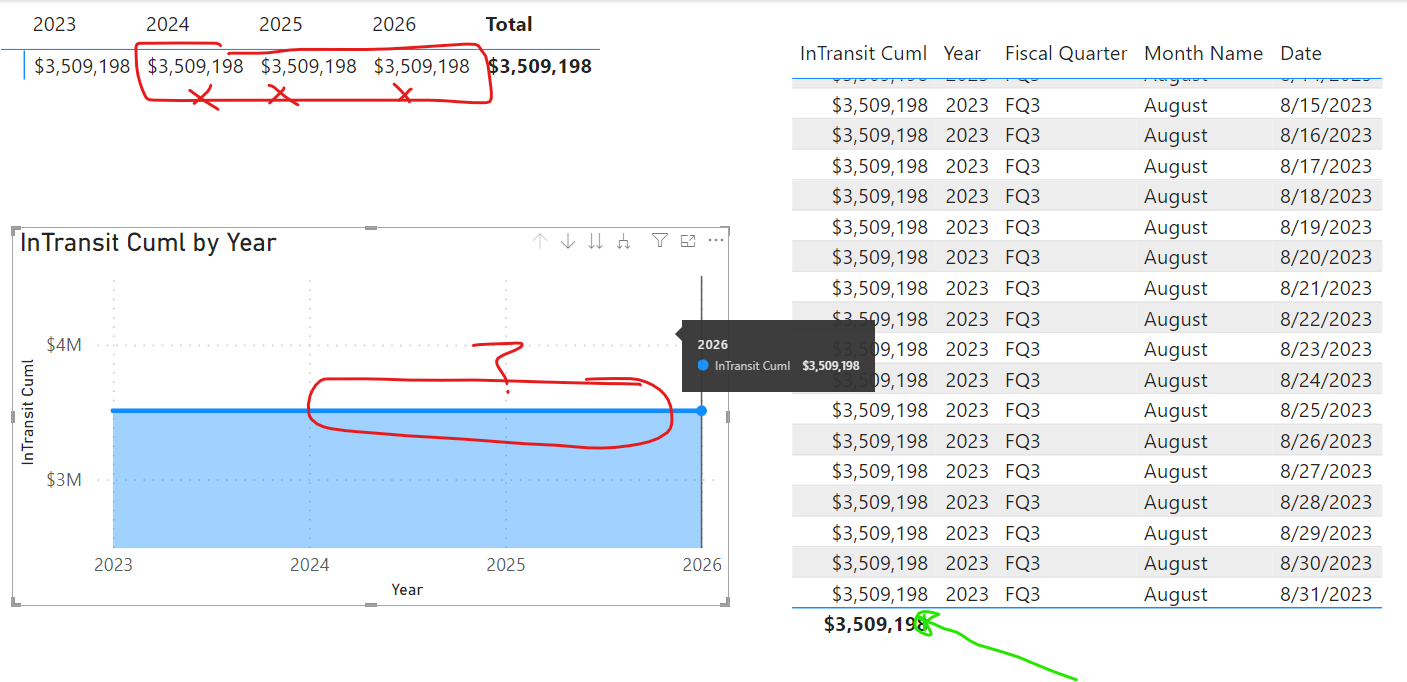
My dax formula seems to be operating properly - i.e. it calculates only up to 8/31 and then the data stops (see green arrow correctly pointing to the data table visual). But in the left side in both the matrix and area visuals the line extends into 2024->2026 even though there is no data there.
If you compare my rudimentary visual from the sample file (also noted screenshot below)
I’m not sure but i think Sam is using a trigger in the date table that will stop at a certain date. There is a column in the date table but i’m not sure what he called it.
ahhh, interesting. I can’t find the original post in here - I can only find the youtube video which sometimes omits these special tricks. the hunt continues
tried the global search and came up with nothing.
which one of these is the ‘education portal’?
I’m struggling with the navigation and all the various portals
click on the down area and review the listing. the courses are under the learning center. might be in labs also. i’m also looking to see if i can see it… did you do the global search in the main portal or the community forum?
You can create a measure like this to control future dates:
ShowValueForDates (Ship Date)
ShowValueForDates (Ship Date) =
  VAR LastDateWithData =
      CALCULATE (
          MAX ( MLSOpenPOTOResults[Calc Latest Ship] ),
          REMOVEFILTERS ()
      )
  VAR FirstDateVisible =
      MIN ( DATES[Date] )
  VAR Result =
      FirstDateVisible <= LastDateWithData
  RETURN
      Result
Measures like [ShowValueForDates (Ship Date)] check if the earliest visible date in a given context (like a chart) is less than or equal to the latest date from the dataset. If the condition is met, it returns TRUE, otherwise it returns FALSE. This can be useful in visuals where you might want to show or hide data based on whether the visual’s date range includes dates with actual data. Like in this case, you are hoping to limit the visual to just the period where you have shipping data.
Then a measure like this could conditionally generate results based on [ShowValueForDates (Ship Date)]:
That takes you only up until your last $ In-Transit value (MLSOpenPOTOResults[Calc Latest Ship] = 8/6/2023). Note, because you have zeroes as actual values from MLSOpenPOTOResults[Calc Latest Ship] = 8/11/23 through 9/22/203, you’ll have a flat line from 8/6/2023 to 9/22/2023.
That’s just a pattern help point you in what I think is the right direction.