Cumulative Pay Period Calculation

Hey Folks,

I have a list of dates that reflect when an employee came onboard (EOD date). I have a list of Pay Period End Dates identifying the end of a pay period. There are 26 or 27 pay periods in a year, depending on the calendar. A pay period is two weeks long and runs from Sunday to Saturday. Each pay period has a number. Ex: Pay Period 18 started on Sunday, August 30, and ended on Saturday, September 12. Pay Period 19 will run from Sunday, September 13, through Saturday, September 26.

I want Power BI to spit out the cumulative number of EODs within a pay period and then be able to graph that cumulative total with a line graph. My first thought, based on my Excel experience, was to look for a binning example to see how their data model was constructed. But I only found examples with numbers, not dates. Then I thought that using something in the date calendar might work. After watching a ton of date videos I don’t feel any closer to creating a data model that works.Cumulative Pay Periods.pbix (214.1 KB)

Can someone point this newby in the right direction, please?

Hi @talk2gwhite. I’m starting to take a look, and I immediately saw your [Date Table] was not marked as a data table; please mark as such and see if this makes things more clear. (That is required for date intelligence to work, and is always the first thing I check/do for every model with a date table.) More soon…Greg

Hi @talk2gwhite,

I hope @Greg won’'t mind me chiming in.

I’ve created the smallest date table ever! (by me at least :wink:)
All you have to do is enter a StartDate, EndDate and the very first FirstPayPeriod in your calendar.

let
    StartDate = #date(2018, 1, 1),
    EndDate = #date(2022, 12, 31),
    FirstPayPeriod = #date(2018, 1, 7),
   
    DayCount = Duration.Days(Duration.From(EndDate - StartDate))+1,
    Source = List.Dates(StartDate,DayCount,#duration(1,0,0,0)),     
    TableFromList = Table.FromList(Source, Splitter.SplitByNothing()),
    ChangedType = Table.TransformColumnTypes(TableFromList,{{"Column1", type date}}),
    AddIndex = Table.AddIndexColumn(ChangedType, "Index", 1, 1, Int64.Type),
    InsertPayPeriod = Table.AddColumn(AddIndex, "Pay Period Start", each if [Column1] < FirstPayPeriod then 0 else Number.RoundDown(([Index] - Date.Day(FirstPayPeriod))/14, 0 )+1, type number)
in
  InsertPayPeriod  

.
With the result that each Pay Period has it’s own unique ID, you can identify them by and use in your DAX calculations. BTW you can remove the Index column of course after the Pay Periods are created and you probably should because it’s at the same granularity as the Date column.

A basic cumulative pattern then could look something like:

Cum Costs = 
VAR _CurrentPayPeriod = SELECTEDVALUE( Dates[Pay Period Start] ) 

RETURN
CALCULATE(
    [Total Costs],
    FILTER(
        ALL( Dates ),
        Dates[Pay Period Start] <= _CurrentPayPeriod 
    )
)

I hope this is helpful.

5 Likes

That is just amazing @Melissa

Your code is always a work of art.

Guy

2 Likes

What does it mean to mark it as a data table? I thought that I just used the M code from Melissa and presto! We got dates!

I’m obviously wrong, but can I get a little more feedback?

Gonna play around with this in a second. I’m wondering, since the pay periods go 26 or 27, and then start again at 1, would this address that or present a challenge? I’ll come back in a few.

But no, I never mind when you chime in. It’s a good thing! Chime, please chime!

Oops … typo … mark as a date table.

Hi Melissa. I had some trouble. I used January 1, 2015 as my START and December 31, 2022 as my END. The first pay period in my data set starts on October 4, 2015 and runs through October 17, 2015. I got an error. Screenshot attached.

Cumulative Pay Periods.pbix (214.1 KB)

Hi @talk2gwhite,

Have you attached the correct pbix file because the give file does not match with your screen shot. Also if possible please share the data source file too.

Hi @talk2gwhite,

Few things to note about the M code provided.
First it generates a Pay Period ID that’s unique and not cyclic. Additional logic would be required for that. Because of this, secondly the parameter value passed to the FirstPayPeriod needs to be within the first 14 days of the date table StartDate.

I’m not near my computer but for the error please check if the values passed to the intrinsic dates are: year, month, day.

I hope this is helpful

1 Like

Updated the date table M function in your file and passed the new FirstPayPeriod parameter
With this result, as you can see a new period starts on October 4th 2015…

Here’s your file. eDNA - Cumulative Pay Periods.pbix (197.6 KB)
I hope this is helpful.

I thought I uploaded the right one. But here it is again.Cumulative Pay Periods.pbix (214.1 KB) Pay Period End Dates.xlsx (9.7 KB) EOD Pay Period calculation.xlsx (21.3 KB)

Hi @talk2gwhite.

Sorry so long to get back to you … prior commitments. Anyway, here goes.

Thanks to @Melissa for the code to put the [Pay Period ID] into the [Dates] table … this simplifies things greatly.

The model just needs 2 tables now, [Dates] and [EOD], with a relationship from EOD[EOD] --> Dates[Date].

The count of EOD’s is then just a simple row count.

Pay Period Count of EOD = COUNTROWS( EOD )

Now I can generate line graphs like these:

Is this something like what you’re looking for?

Hope this helps.
Greg
eDNA Forum - Cumulative Pay Periods V2.pbix (201.2 KB)

This is moving in the right direction. Ultimately, I want to be able to produce something like the attached image. The pay periods are at the bottom. And the line is at the top. On the image, the date is the Monday after the pay period closes.cumulative graph of pp EODs

Hi @talk2gwhite,

:thinking: This would have been useful information in your initial post…

I’ve reworked the Date table M code, this now includes a ReportDate attribute for each Pay Period.

Next created a basic Cumulative measure:

Cum Count of EOD = 
CALCULATE( [Pay Period Count of EOD],
    FILTER( ALLSELECTED( Dates ),
        Dates[Date] <= MAX( Dates[Date] )
    )
)

All put together it looks something like this.

Here’s the updated sample file. eDNA Forum - Cumulative Pay Periods V2.pbix (216.0 KB)
I hope this is helpful.

1 Like

Hi @talk2gwhite.

The benefits of the forum … I was just about to post almost exactly the same thing, albeit without the extra code to generate your Monday-after-pay-period-end-date Report Date@Melissa beat me to it :slight_smile:

Just for completeness, here’s what I wrote:

A small modification should get you close to where you’re going. You can use the Cumulative Total DAX pattern

to create the measure of interest, something like:
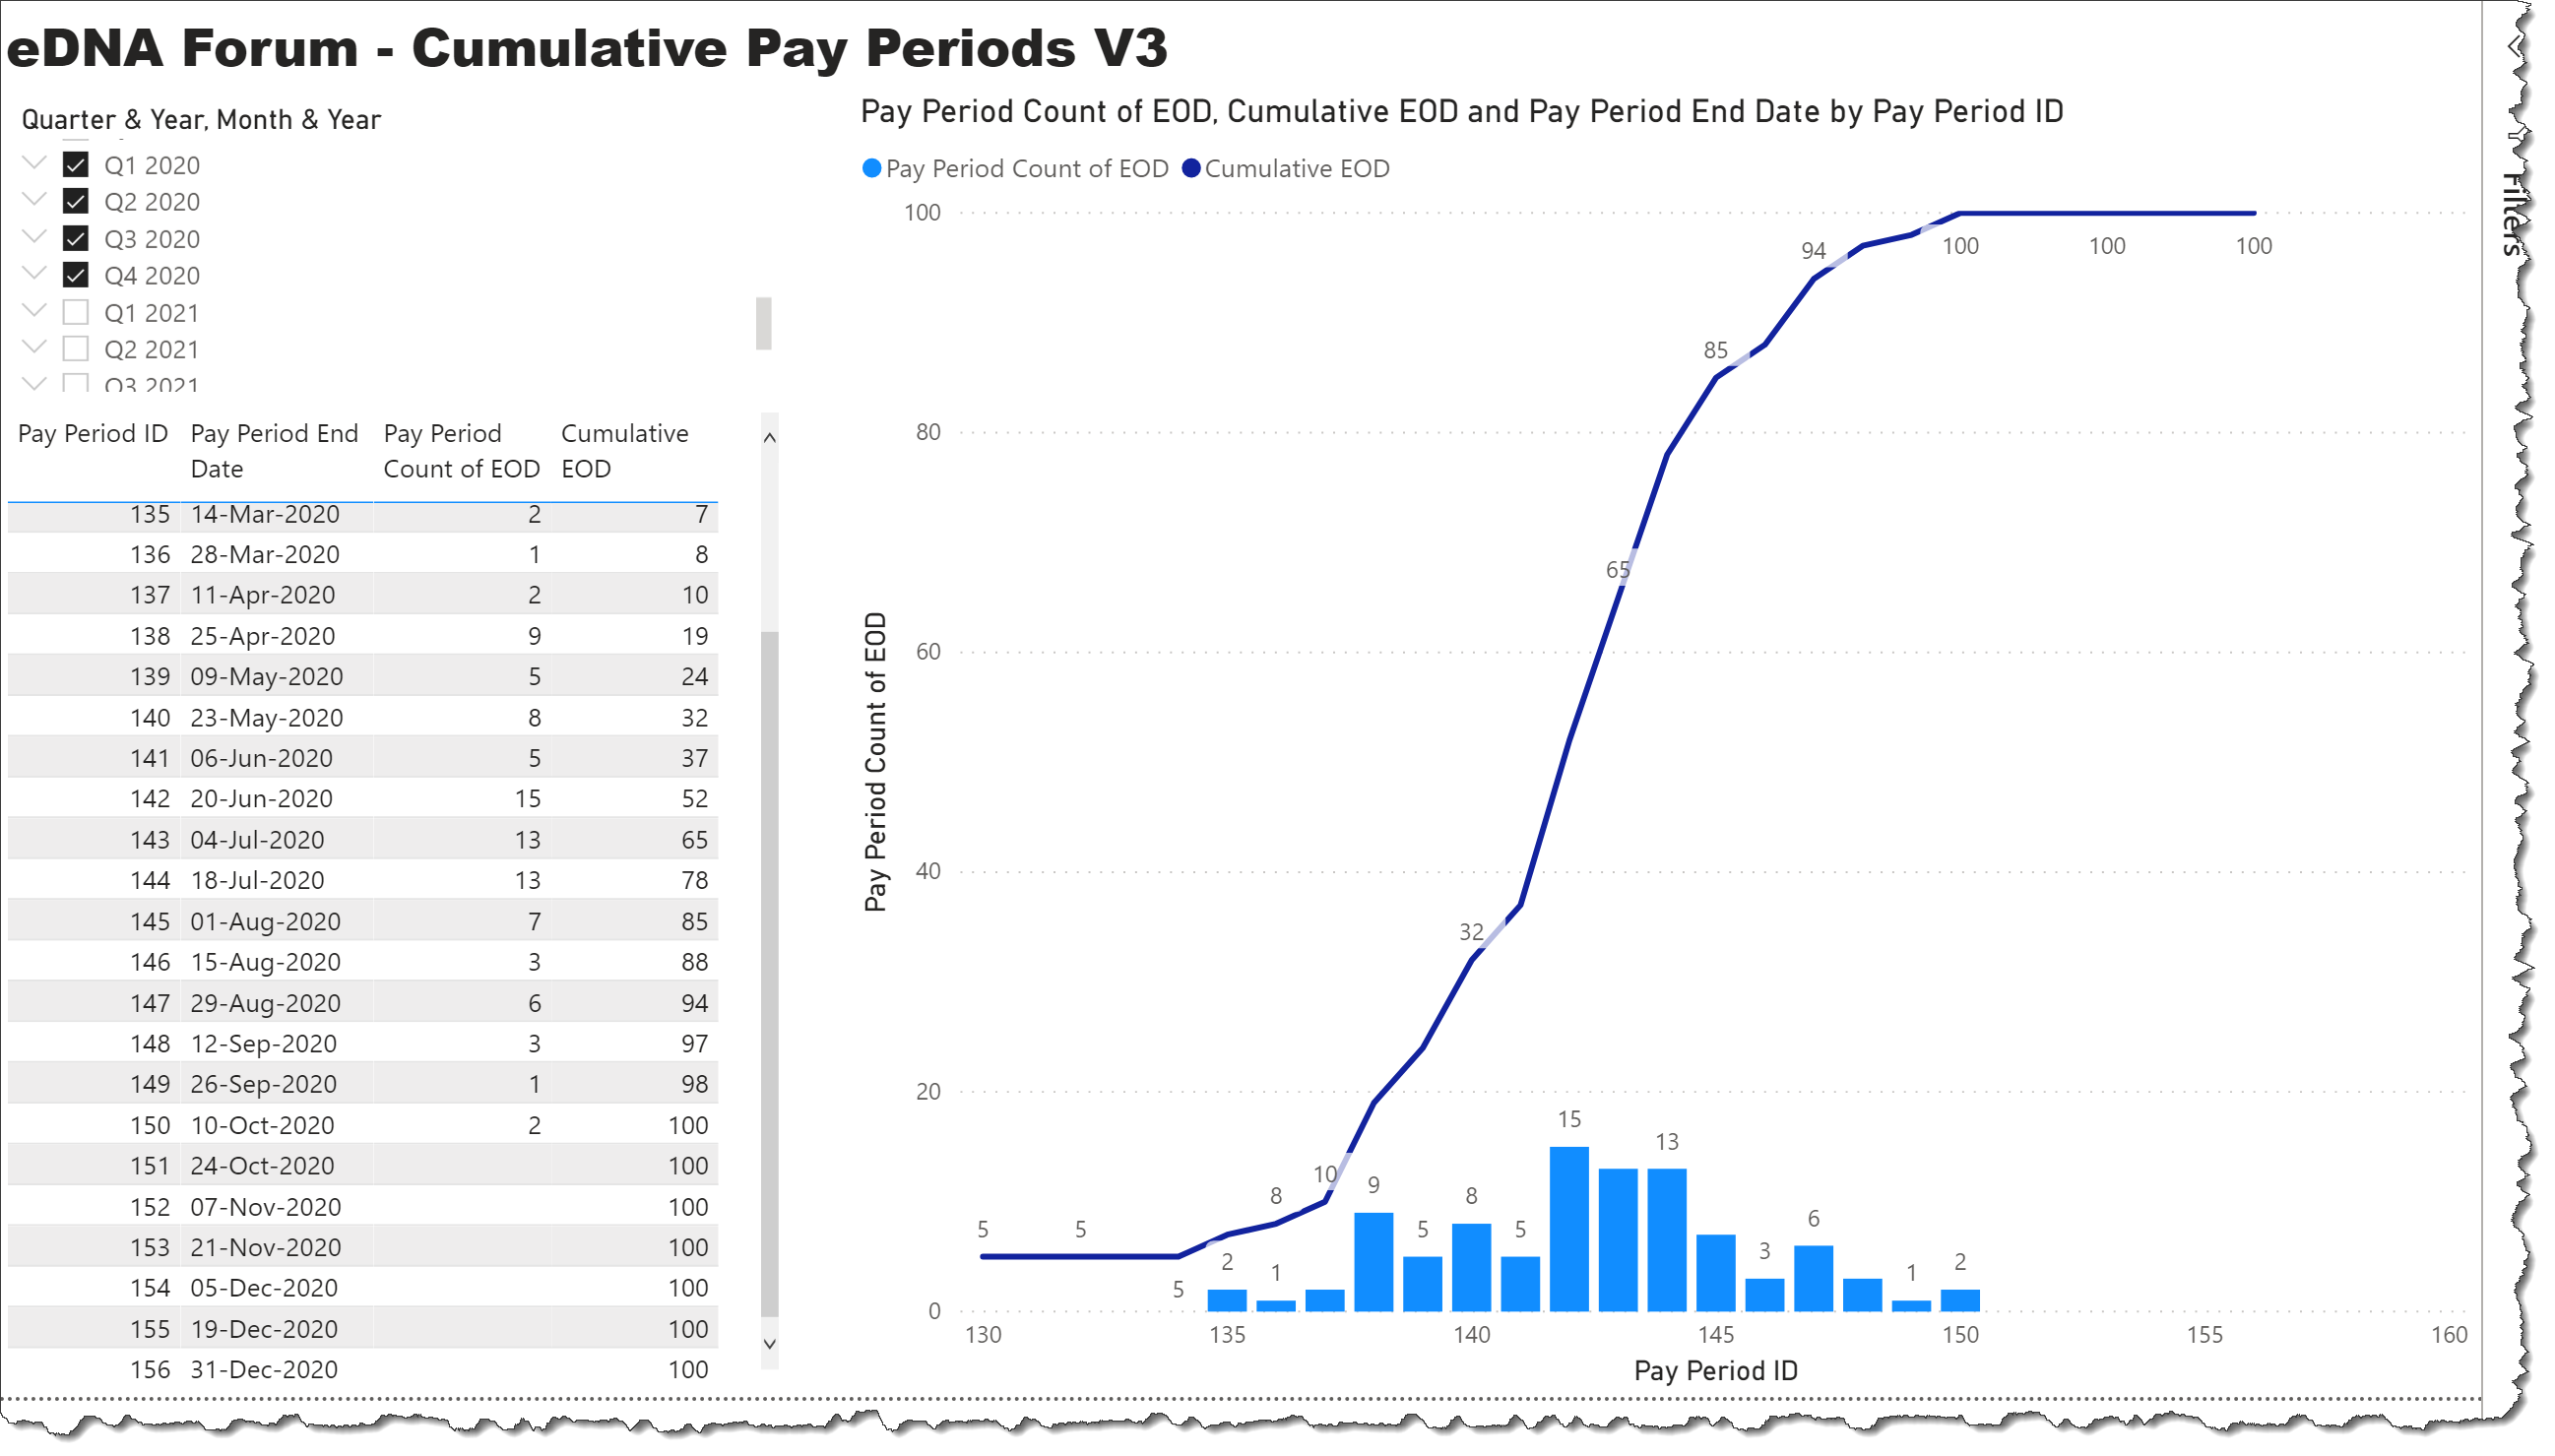
Cumulative EOD = 
CALCULATE( [Pay Period Count of EOD],
    FILTER( ALL( Dates ),
        Dates[Date] <= MAX( Dates[Date] ) ) )

Then you can change the line chart to a combo chart, add the new cumulative measure to the line series, and turn on data values.

Hope this helps.
Greg
eDNA Forum - Cumulative Pay Periods V3.pbix (201.7 KB)

1 Like

I apologize. I’m learning and working and trying to apply learnings all at the same time. I truly appreciate your insight. I feel terrible. :frowning:

This is awesome! Thank you as well, Greg.

Don’t feel bad, it’s just something to keep in mind.

LOL. I think the same can be said for everyone trying to provide support on the forum :wink:

2 Likes