Hey Folks,
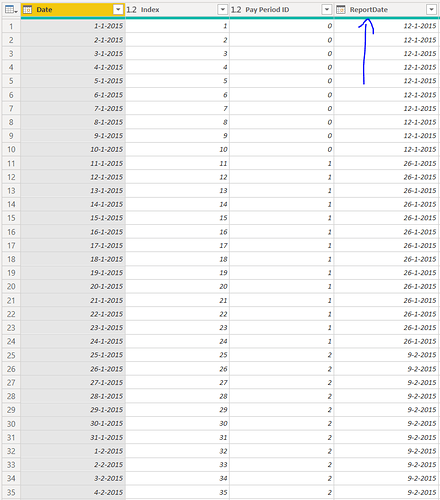
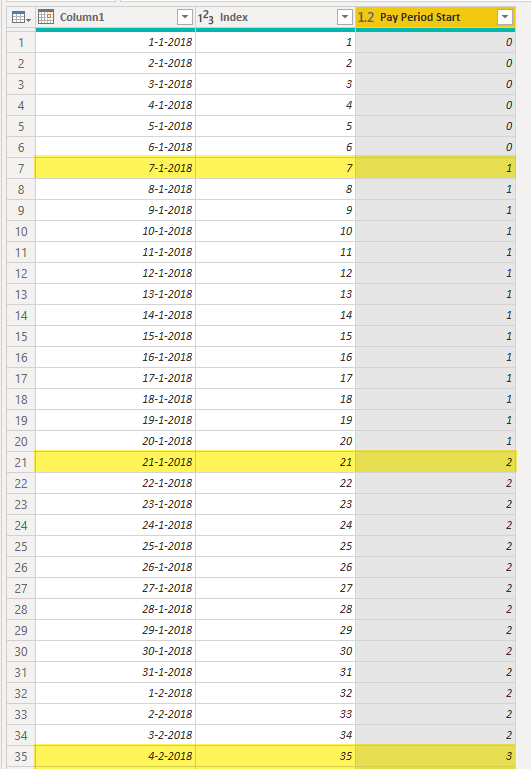
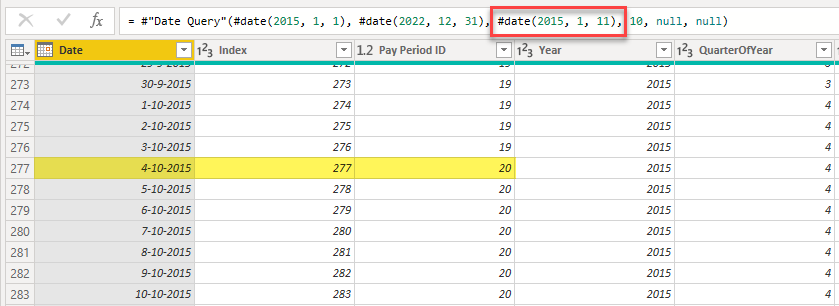
I have a list of dates that reflect when an employee came onboard (EOD date). I have a list of Pay Period End Dates identifying the end of a pay period. There are 26 or 27 pay periods in a year, depending on the calendar. A pay period is two weeks long and runs from Sunday to Saturday. Each pay period has a number. Ex: Pay Period 18 started on Sunday, August 30, and ended on Saturday, September 12. Pay Period 19 will run from Sunday, September 13, through Saturday, September 26.
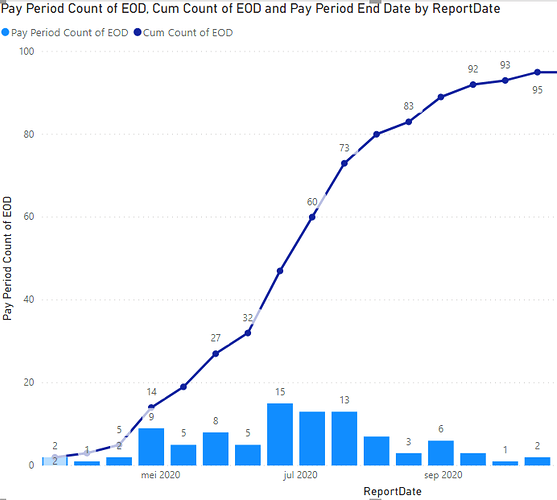
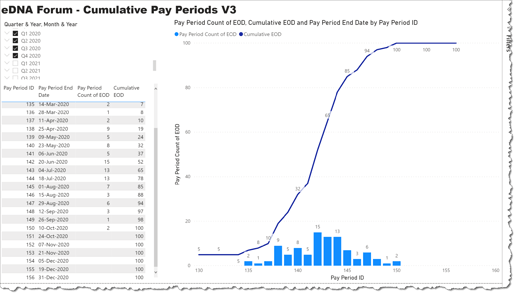
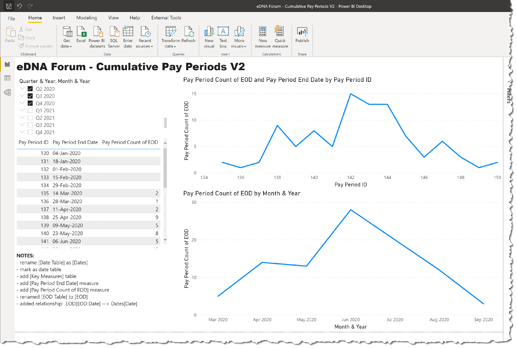
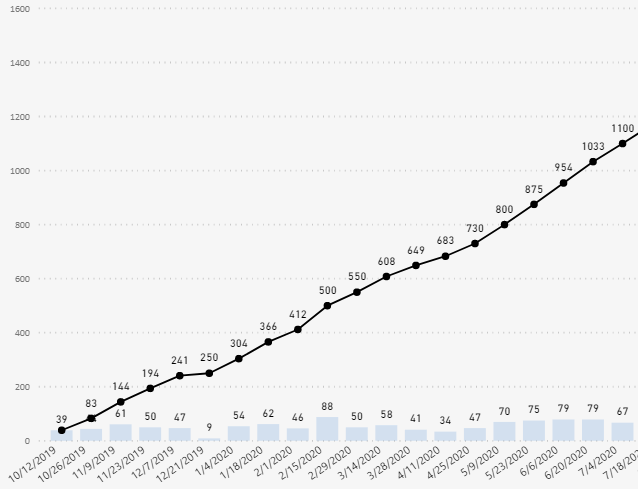
I want Power BI to spit out the cumulative number of EODs within a pay period and then be able to graph that cumulative total with a line graph. My first thought, based on my Excel experience, was to look for a binning example to see how their data model was constructed. But I only found examples with numbers, not dates. Then I thought that using something in the date calendar might work. After watching a ton of date videos I don’t feel any closer to creating a data model that works.Cumulative Pay Periods.pbix (214.1 KB)
Can someone point this newby in the right direction, please?
 )
)


 This would have been useful information in your initial post…