Hello,
I have a table of pledge information containing a list of donation pledges and amounts still outstanding with many years worth of information.
It is a requirement that on the same page I have two different types of cumulative calculations.
The first is the normal that shows the total pledges up to the date.
The other needs to only show the pledges that have been acquired from July 1 2018. To complicate things, these second calculations also need to be independent of any date slicers chosen so that when the date slicers choose different years, the person can compare the previous years to how those years progressed against 2018 and beyond.
I have tried to use
Total Pledges since July 2018 =
CALCULATE(
[Total Pledges],
FILTER(ALL(Dates),
Dates[Date] >= DATE(2018, 7, 1)
)
)
and
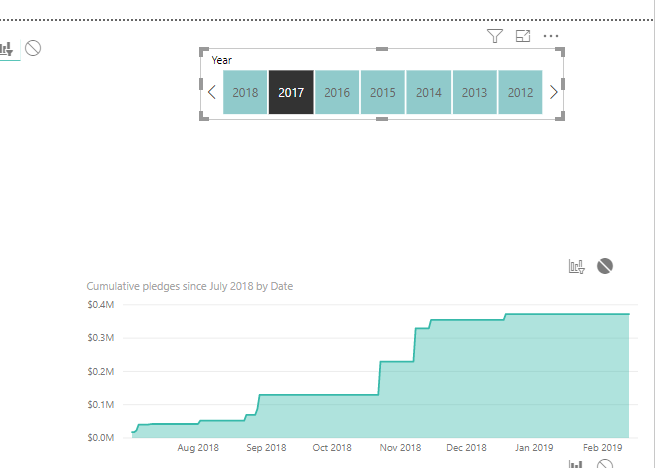
Cumulative pledges since July 2018 =
CALCULATE(
[Total Pledges since July 2018],
FILTER(
ALLSELECTED(Dates),
Dates[Date] <= MAX( Dates[Date])
)
)
but these do not give me the desired result.
I have attached a sample Power BI file
Pledges.pbix (414.3 KB)
I am wondering if I need another date table, but not sure how to incorporate that into the model
Any ideas most appreciated.
Thanks