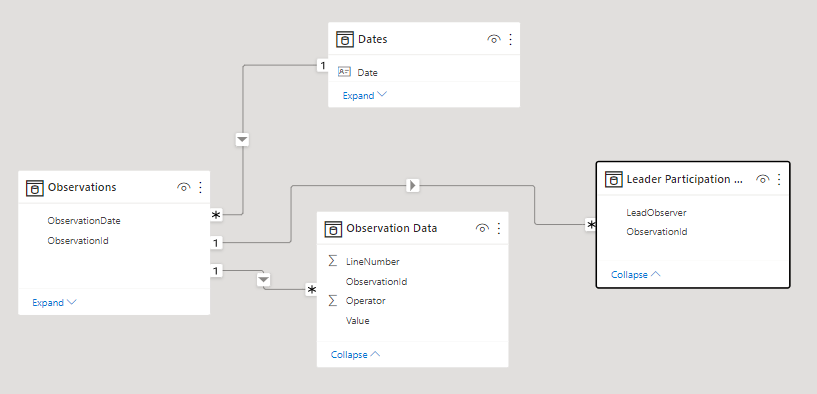
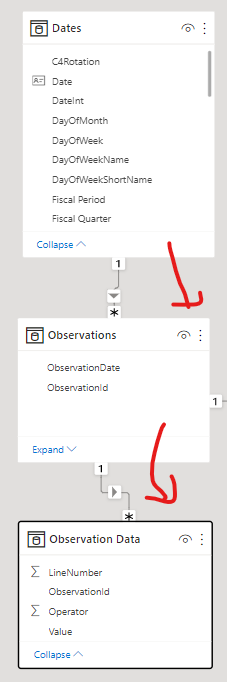
I really don’t know if my topic title accurately reflects my issue, but here’s my situation… I have data regarding observations that leaders conduct of employees in the field to determine if their behaviors are “safe” or “unsafe.” I have broken the data into three tables:
Observations: info about the observation event (there are several additional columns in the real dataset)
Observation Data: the actual behaviors observed during each observation
Leader Participation Data: which leader conducted which observation (this is in a separate table because in the real dataset, it is more complex than what I have included in my example, i.e. multiple observers, lead observer vs. “other” observer, etc.)
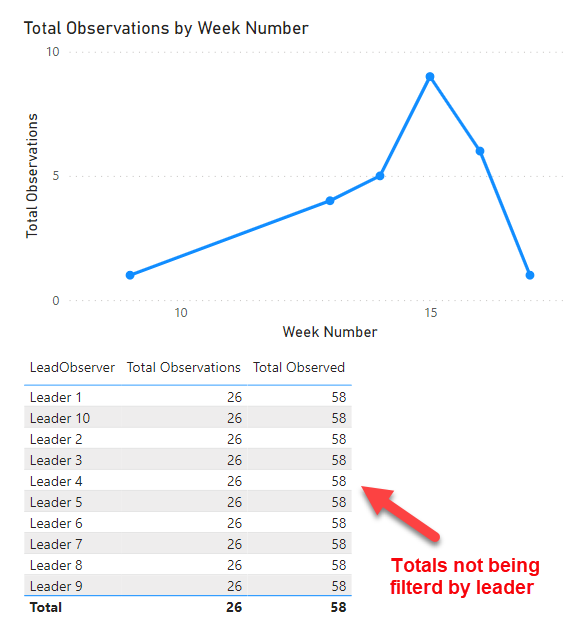
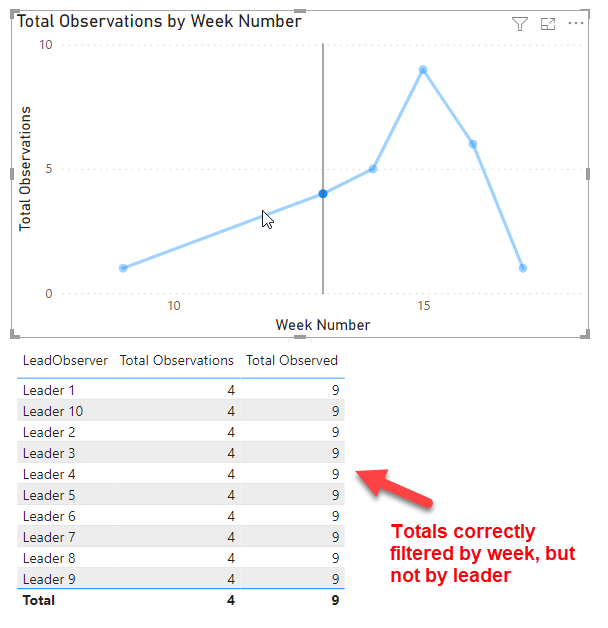
As shown in my sample PBIX file, I need a line chart showing how many observations occurred each week, and a corresponding table showing the leaders names, how many observations they conducted, and how many people were observed during those events. What I am seeing currently is a list of all leaders with the totals next to each name without being filtered. Furthermore, when a user selects an individual point (week number) in the line chart, I need the table to filter accordingly. It is currently filtering correctly the number of observations and people observed for that week, but displaying the overall total for that week number next to each leader name. The attached screenshots show what I am currently seeing.
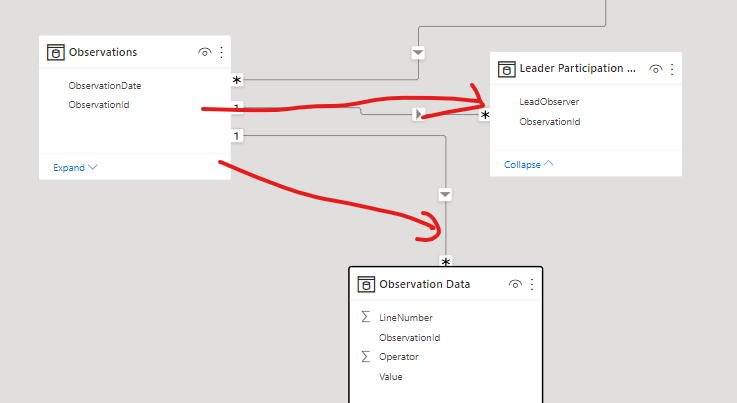
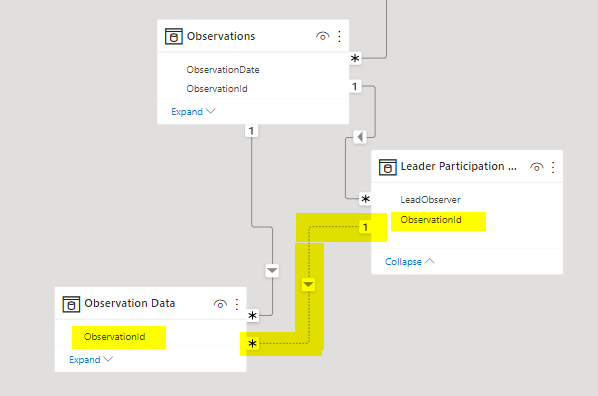
The issue is most probably because the relationships from Observations are moving out to parallelly to Leader Participation and Observation Data tables. They should all be lined up serially.
I would suggest that you move LeaderObserver column from Leadership Participation Data table to Observations Table using Merge Option in Power query and hiding the Leader Participation Data table. This will result in the relationship flowing from Dates table to Observations Table to Observation Data table. This should resolve all your above issues.
Thanks for the suggestion. I had also thought of that. The problem is that this is a scaled-down fictitious data model. In the real one, the Leader Participation Data table has additional data in it which results in a variable number of rows per ObservationId meaning that I can’t merge it all into a single row in the Observations table. Merging would create multiple rows per ObservationId in the Observations table resulting in a many-to-many relationship between the Observations and Observation Data tables.
Thank you for your response. Would it be possible to use Group By to Merge variable rows of additional data in Leadership Participation Data (or a reference table) into a single row per ObservationId to get around the many-to-many relationship issue?
So far, all I have been able to do to get it to work is to make the relationship between Observations and Leader Participation Data go both ways. I know that’s not ideal, and I’m keeping my eyes open for unintended consequences, but that’s the only way I’ve been able to get it to work so far.
Hi @DaveC, did the response provided by the users and experts help you solve your query? If not, how far did you get and what kind of help you need further? If yes, kindly mark as solution the answer that solved your query. Thanks!
Hi @DaveC, due to inactivity, a response on this post has been tagged as “Solution”. If you have a follow question or concern related to this topic, please remove the Solution tag first by clicking the three dots beside Reply and then untick the check box.