I have unique kind of scenario need your help on implementing same in Power BI which I have in excel format but am struggling to plot it in Power Bi in Matrix Table Format.
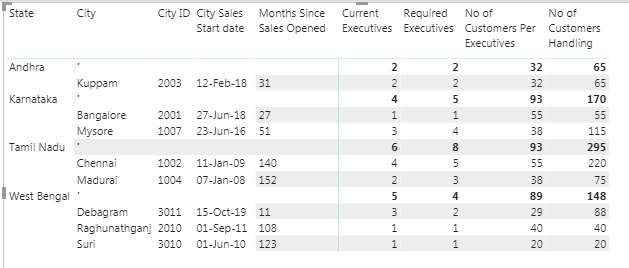
So basically I required the Matrix Table in the below format in Power BI which I have done in Excel using the Employees Data, It simple in Excel but am really struggling to find a solution to plot in Power Bi since this is everyday work I have to deal with. Data.xlsx (12.1 KB)
I really appreciate Solution for the same.
The below format to be replicated in Matrix Table in Power BI.
This is what I was able to achieve hope this is what you were looking for.
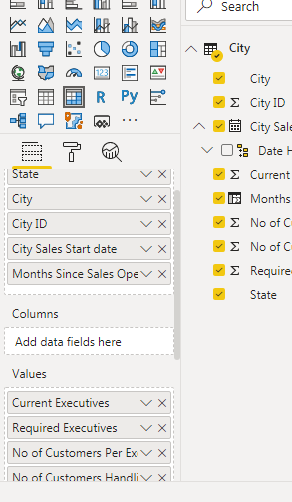
Please find attached pbix file for your reference. Here you need to follow the formatting Below are the step by step explanation.Create Unique Table in Matrix format.pbix (84.5 KB) You can see the pbix to understand more.
A. click on the double arrow icon to expand the Pivot(until it becomes grey)
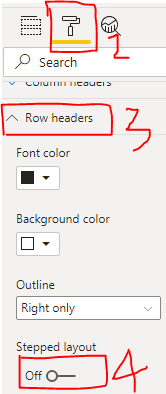
B. Then click on the Format Tab in the Visualizations Pane
C. Roll down to Row Headers
D. And turn off Stepped Layout
Adding / Removing Subtotals and Grand Totals
A. Goto to Subtotals
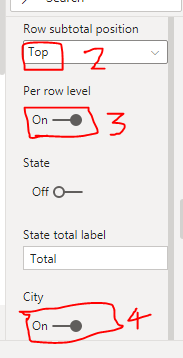
B. In Row subtotal position change to Top
C. Turn ON Per row level.
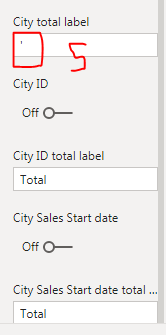
D. Turn off for all the column except City
E. Change the value from Total to single quote as we can’t have blank.
Hi @Dharma, did the response provided by @MK3010 help you solve your query? If not, how far did you get and what kind of help you need further? If yes, kindly mark the thread as solved. Thanks!