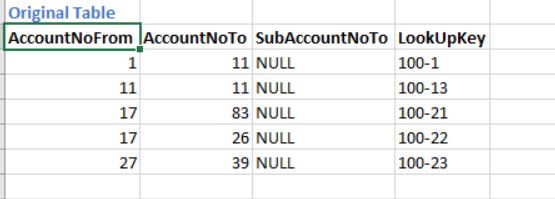
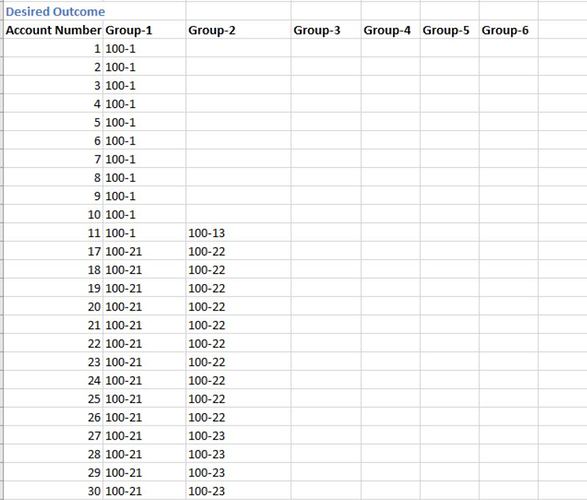
I have a table that looks like Original Table in the attached spreadsheet.

-
As you can see, instead of one row per account, there is a range per group.
-
Each Account can belong to more than one group. Basically they are nested.
I think I need to transform it into the Desired Outcome.
I assume I will need some type of loop. Can anyone suggest where I might start please.
Thank you,
Paul
Sample File.xlsx (16.5 KB)
Hi @kellysolutions,
Loaded the data and removed the unused column

Created Lists for each range

Expanded the Lists and Grouped By them

Retrieved the LookUpKey and Extracted the items
Finally split the column into 6 Groups
Here’s your sample file. Creating Rows and Columns form one Row.pbix (23.5 KB)
I hope this is helpful.
4 Likes
@Melissa this is incredible. Thank you.
How do you know all of this?
Jut trying to get my head around Grouping the Lists
1 Like
Glad I could help Paul 
Well definitely been where you’re at - so I wouldn’t worry to much… Spent quite a bit of time inside the Query Editor since then working through solutions others had created, looking stuff up in the M function library, language specification and googling.
And here’s the good news - eDNA is working hard to extend the courses within the portal, additional Power Query modules will hopefully become available some time next year, so you can take the shortcut 
2 Likes
Hi @kellysolutions, did the response provided by @Melissa help you solve your query? If not, how far did you get and what kind of help you need further? If yes, kindly mark the thread as solved. Thanks!
1 Like
Hi @kellysolutions, a response on this post has been tagged as “Solution”. If you have a follow question or concern related to this topic, please remove the Solution tag first by clicking the three dots beside Reply and then untick the check box. Thanks!


