Hello EDNA Forum
Good Day!
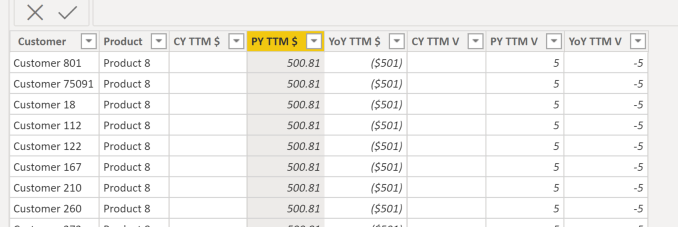
I need to create a table from existing data columns ( customer and products) along with dax measures I have already created.
Here is an example…
Thank you in advance from you time and help!
Regards,

Hello EDNA Forum
Good Day!
I need to create a table from existing data columns ( customer and products) along with dax measures I have already created.
Here is an example…
Thank you in advance from you time and help!
Regards,

Hi @ambidextrousmentally. Your description of the issue and your desired outcome are not clear. Please attach your work-in-progress PBIX file (with sanitized or sample data, if necessary) along with a marked-up screenshot or Excel mockup (using the same data) of your desired outcome to help the forum members.
Greg
Hi Greg
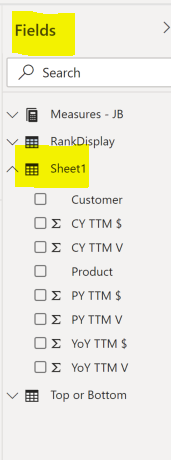
I’m referring to sheet 1.
Attachment:
Also,
I have the following question re: the Product section of the model.
Much appreciate your help!

Hi Greg
Additional info
This is a sample dataset
In my model I have created Dax measures
CY TTM PY TTM and TTM $.
I have a separate table with my customer and product data. My question is how do I create sheet 1 in the sample data in my model to have the top n and bottom n to work properly. I believe I need this table to work with my dax measures - customer n and product n …along with the other dax measures.
Thank you
Hi @ambidextrousmentally. Sorry, I don’t see a sheet 1 in your attached PBIX. Please take a screenshot of the visual you are having an issue with in your PBIX and either mark-it-up or attach an Excel mock-up of the outcome you’re looking for.
Greg
Hi Greg
Here you go…

Sorry @ambidextrousmentally … still not clear at all … you’re obviously not just looking for this data to be presented in a simple table or you wouldn’t be asking the question. Please make a table visual in your PBIX with the data you can take from your [Sheet 1] table, take a screenshot of the visual and either mark-it-up or attach an Excel mock-up of the outcome you’re looking for.
Greg
Hi Greg
Something is being missed in the communication via IM. Can you give me a call so I can make my point clearer?
Unfortunately no … for other forum members to comment on your issue, and for the education of members, all discussions should be available to all. If you wish to pursue your issue on the forum, please prepare a PBIX with the visual in question, clearly describe the issue, and provide a marked-up screenshot or Excel mockup of the outcome you’re looking for.
Greg
Additional Information
Sheet 1 is a summarized table of the table and the measure for each customer.
My measures are already created
Hi Greg
Does this help? I have already provided the PBIX. I’ trying to create a summarized table - which is Sheet 1 in my PBIX from a table in my model and the measure that I have already created.
Hi @ambidextrousmentally. Again, unfortunately doesn’t help much … you’re obviously looking for something more that a simple table with Table[Customer] column, Table[Product] column, [CY TTM$] measure, [PY TTM$] measure, [TTM$] measure, and I don’t see what that is.
Greg
Hi Greg
I will forward another pbix. with a table and the measures.
To confirm what else do you need? Ultimately what I’m trying to accomplish is a Top N Bottom N model with the same slicer from the pbix which I have sent to you.
Thanks for you follows and help!
Regards,
Greg
Here you go per our conversation, does this work. First off, I 'm having an issues with putting my measures in a matrix. They are not coming populating as expected.
Dax Measure Example 03 17 21.pbix (6.1 MB)
I’ll recuse myself from further pursuing this thread as we’re 16-posts-in and I’m still not clear on what is the issue nor what is your expected outcome. To hopefully help other forum members visualize your issue, please be as specific as you can, take a screenshot of the visual you’re having an issue with, and mark it up with what you are expecting. An Excel mock-up of your final desired outcome would also be of assistance. Your statement " … not coming populating as expected …" unfortunately does not provide any insight.
Good luck.
Greg
Hi Greg
Thank you for you time! This was a great learning experience communicating via IM in the EDNA forum.
I have to do better.
Regards,
Hello @ambidextrousmentally,
if i understood your request well, i think you want to display the top N customers and the products they purchased based on the CY TTM. I tried to prepare a response for you. i will send it and then we can discuss it later. For the dynamic label. Yes you can make it dynamic, i just don’t what u want to show exactly. So i have made an example in the pbix file attached below.
Check the file. and mark this as a solution if it’s what you looking for.
PS : i just show TOP N in the demo, you can just change the order in the measure (ASC instead of DESC) and you can have the Bottom N
Hello Hassan_BI
Good Day!
Correction please change to YoY TTM $.
Also, per Dax Measure Example 03 18 21 TNBN_Display Modification.pbix (2.2 MB) the the attached PBIX,
What I’m trying to accomplish
Per the matrix Top and Bottom , how can I modify the Dax measures to only show what is selected in the RankDisplay
For Example*
When I select 5 in the RankDisplay I only want to see the 5 Customers lines on top and 5 products lines on the bottom.
Much appreciate your help!
Thank you
Regards,
Attachment: