Hi there,
I have a fact table that is connected to the date (dimension table) using the date column. The fact table contains information about events. I created measures that calculate the total no of events, total no of people who visited events, the average length of the event, Average no of people who visited the event, etc.
Now I want to calculate three filters related to date i.e. ‘Today’, ‘in last 2 days’, and ‘Last 10 days’. I want to set up filters in such a way that for example, if I select ‘in last 2 days’ from the slicer, all measures present on the page show the result w.r.t last 2 days.
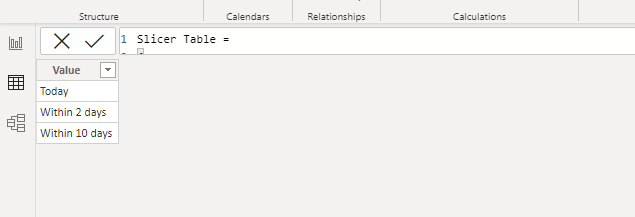
So, first I created a table that contains all three filter values as shown in the picture:

I named the table as ‘Slicer table’. I used the value of the slicer table to generate the slicer visual.
Then I created a measure that selects the value (shows as follow):
User Day Selection = SELECTEDVALUE(‘Slicer Table’[Value])
Then I created a final measure something like as follow:
Calculation day =
SWITCH(
TRUE(),
[User Day Selection] = "Today", IF(DATEDIFF(MAX('Fact Table'[Date]),TODAY(),DAY) = 0,1),
[User Day Selection] = "Within 2 days", IF(DATEDIFF(MAX('Fact Table'[Date]),TODAY(),DAY) <= 2,1),
[User Day Selection] = "Within 10 days", IF(DATEDIFF(MAX('Fact Table'[Date]),TODAY(),DAY) <= 10,1)
)
Now I am bit lost, I am not sure where and how to apply the final measure.
When I googled it, I found measures that can do the similar operations and they applied on particular visual (such as a table, card ) but not on the page level. I am a bit lost and don’t know how to do it. Could anyone help me in that regard?
