Creating groups from a Measure

HI,

Can someone help me on how i create a group based on a overlapping range of data?

I have calculated my Z Scores and i want to create groups now based on the 3 sigma levels. I know how to use secondary logic tables however its not working correctly as the data range overlaps.

For example i need as per below

Capture

The issue is that the 3 sigma range is from -3 all the way back to 3 which crosses the other 2 sigma levels like -2 to 2 and -1 to 1.

When i drop this into my table i get partial results. PBIX attached

Sigma Level Group =
CALCULATE( SELECTEDVALUE( ‘Sigma Level Groups’[Sigma Level] , BLANK() ),
FILTER( ALL( ‘Sigma Level Groups’ ),
[zscore] >= ‘Sigma Level Groups’[Min] &&
[zscore] < ‘Sigma Level Groups’[Max] ) )

Power BI Initiatives.pbix (1.3 MB)

This really isn’t possible using the traditional grouping methodology showcased in a few locations, like so…(if you have it setup this way atleast)

Have you thought thogh about ways to separate out your groups in more groups (ie. have the +ve and -ve grouping broken out. Then you would not have min or max overlapping.

This would make sense to do it this way for me.

Also you could have a look at using the conditional formatting techniques for visualization this information.

Check out the below video for ideas on this.

Again you would probably want to break out your groups more for the +ve and -ve numbers but atleast you could get the colours easily matching.

See how you go.

Thanks
Sam

Hi Sam,

The problem is they will still over lap as everything starts from 0

For example

Sigma Level Dax Table = DATATABLE(
“Sigma Level”,STRING, “Min”,STRING, “Max”,STRING, {
{"+1 Sigma",“0”,“1”},
{"+2 Sigma",“0”,“2”},
{"+3 Sigma",“0”,“3”},
{"-1 Sigma",“0”,"-1"},
{"-2 Sigma",“0”,"-2"},
{"-3 Sigma",“0”,"-3"}
})

I want like a range recognition really is that possible? im not sure im looking at this the right way ? i want to be able to selct a sigma level and only show those results i dont really need them in a column as im trying to do here. could grouping be used some way? but i need a selector on screen to click and show the results of the 3 levels.

can you have a look and give me an idea?

like if range - 3 to 3 then all results are at stage 3 sigma any result lower than -3 and higher than + 3 should be ignored and if they are -2 to 2 then its all results are 2 sigma and -1 to 1 is one sigma.

Does that make sense?

Power BI Initiatives.pbix (1.3 MB)

How about not starting it from zero though everytime?

You can only have one answer per value right, so having them overlapping doesn’t really make sense. If you do this there’s the potential for every value to be in multiple buckets and have multiple answer which I presume is not what you want.

Sam

The issue is the the range.

I need 3 filter types

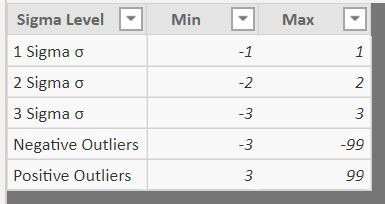
-3 to +3 range is 3 Sigma
-2 to + 2 range is 2
-1 to +1 range is 1 Sigma

They all run through zero.

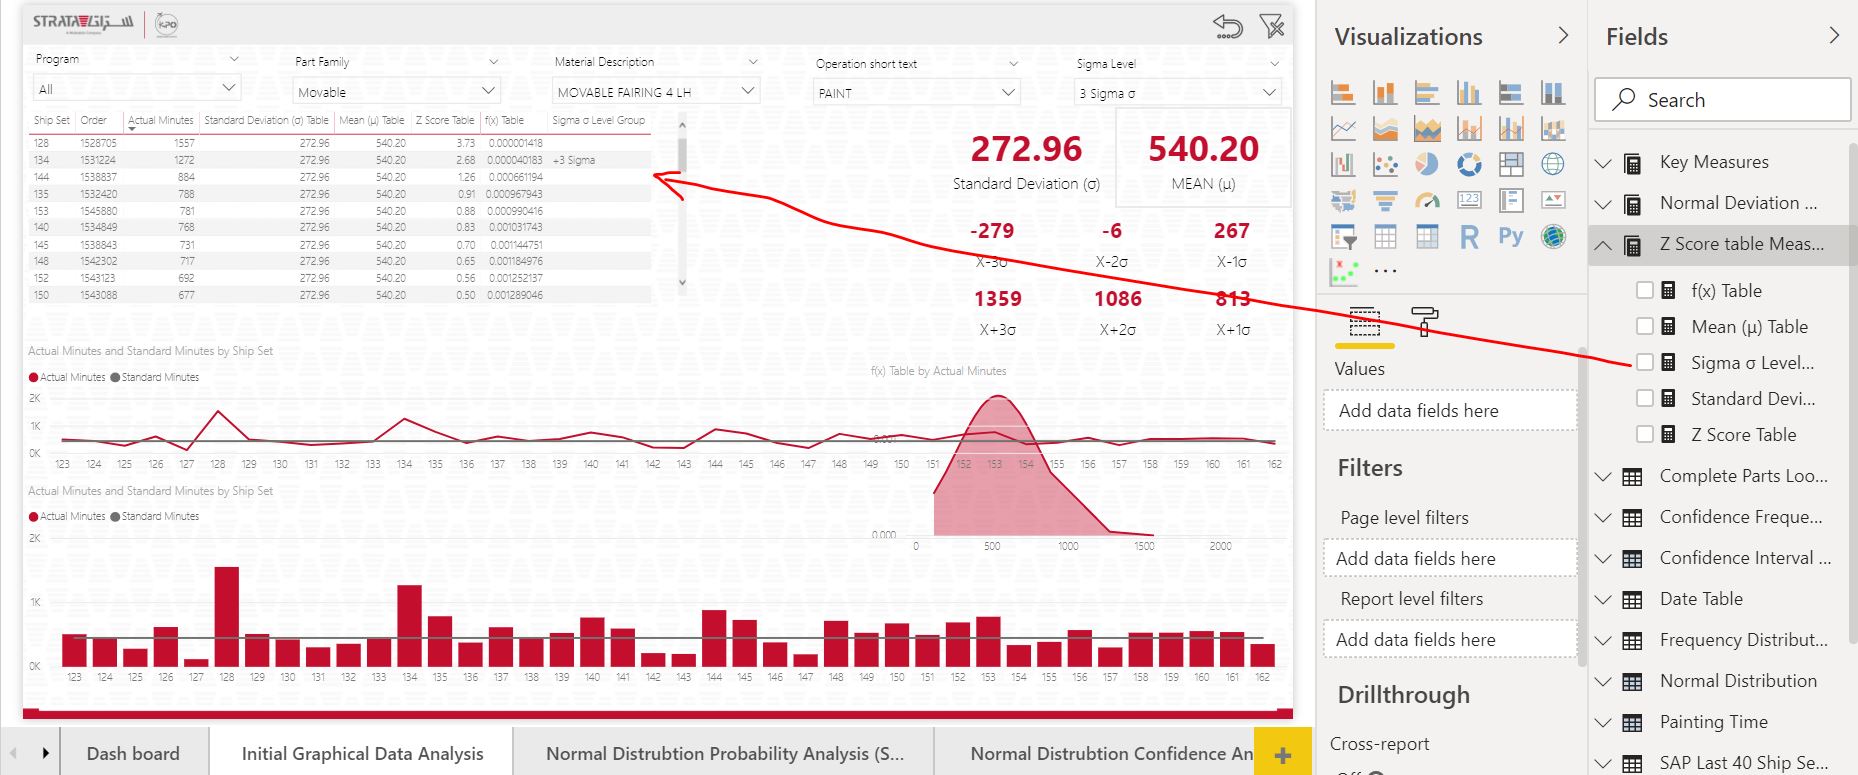
I need to be able to click the slicer for 1 2 or 3 sigma and only show those values.

for example if i have a data set that runs from - 10 to + 10 and i click the slice button 3 sigma i want to see all values that are in the range of - 3 to +3 and remove any value > 3 3.01 to 10 and less then < - 3 removing -3.01 to -10.

2 sigma removes < -2 > 2
1 Sigma removes < -1 > 1

That make sense?

Maybe another option is use secondary logic table with the 3 Sigma levels in it and right a dax formula that filters the table to selected value? not sure sounds easy in my head but cant get a working solution.

Maybe something like

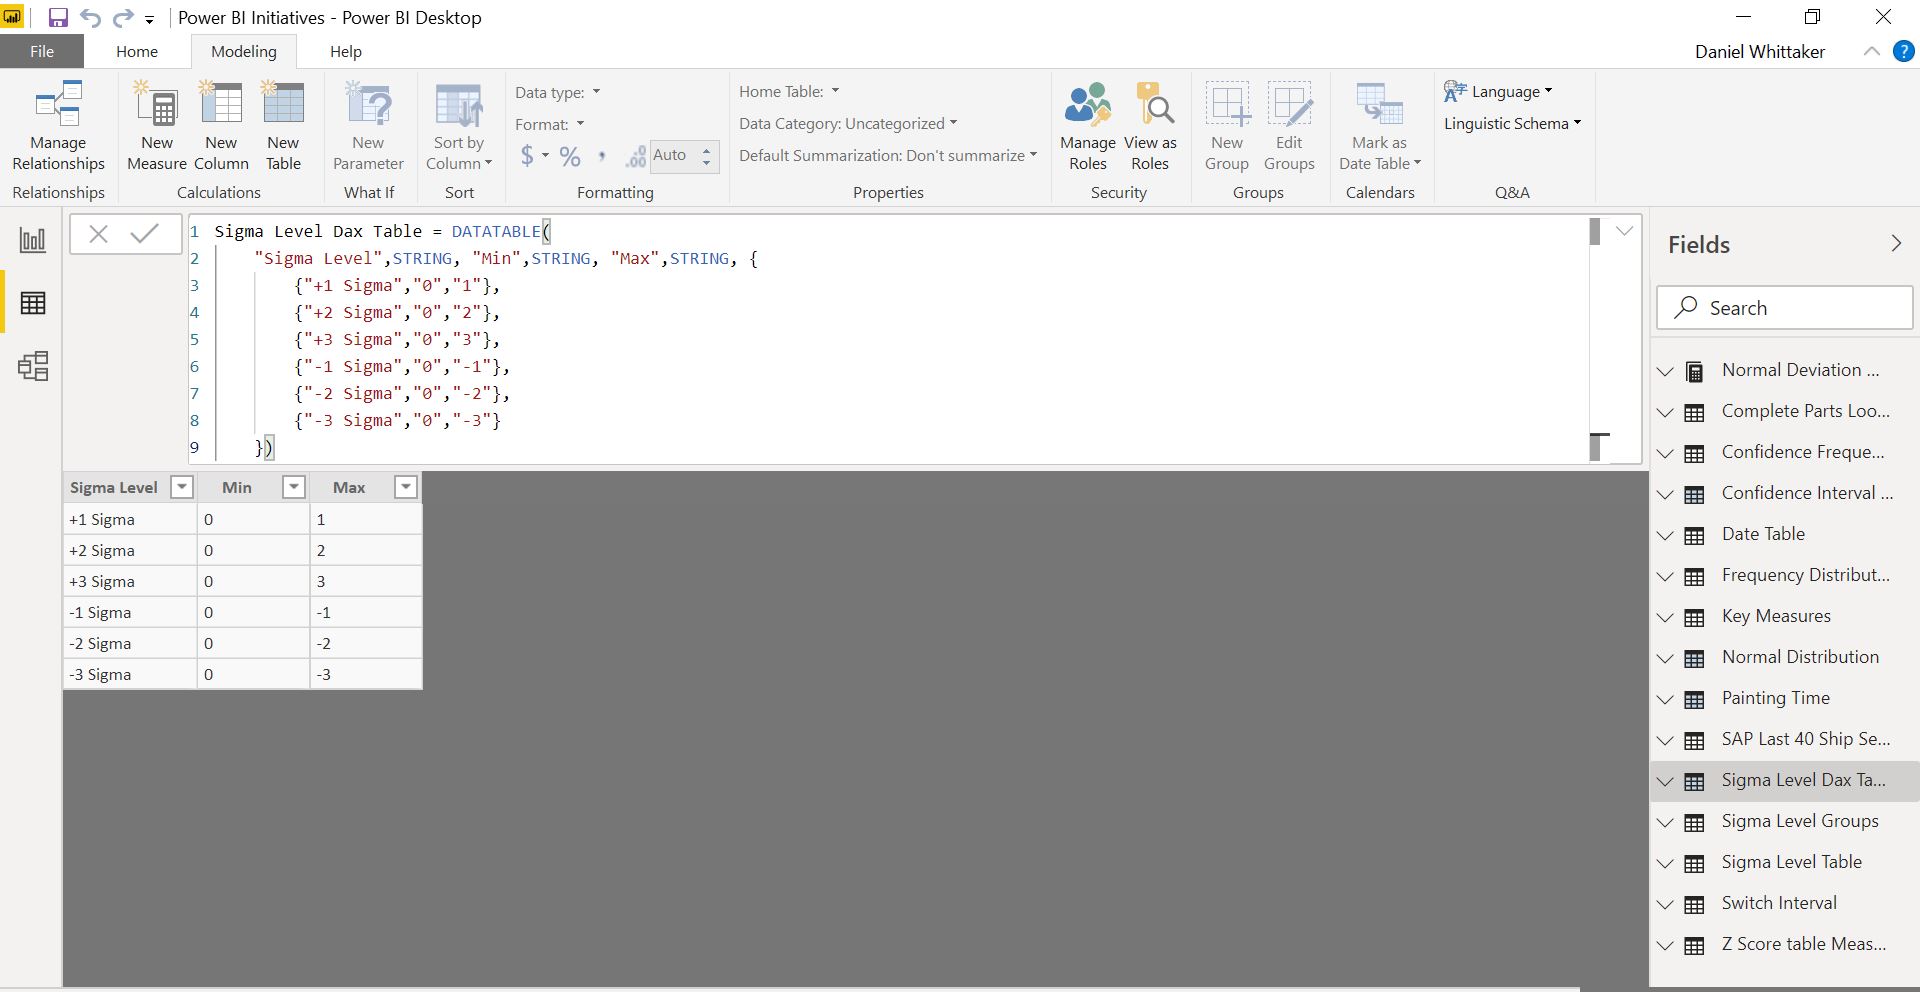
Create a secondary table

Sigma Level Dax Table = DATATABLE(
“Sigma Level”,STRING, “Sort”,INTEGER, {
{“1 Sigma”,1},
{“2 Sigma”,2},
{“3 Sigma”,3}

})

Then filter against that using a measure? something like this? is that dooable? as i cant seem to get it to work

Sigma Level Filter =
SWITCH (
MIN ( ‘Sigma Level Dax Table’[Sort] ),
1, CALCULATE ( [Actual Minutes], FILTER ( ‘Z Score table Measures’,‘Z Score table Measures’[Z Score Table] >= -1 && ‘Z Score table Measures’[Z Score Table] <= 1 )),

2, CALCULATE ([Actual Minutes],FILTER ( 'Z Score table Measures','Z Score table Measures'[Z Score Table] >= -2 && 'Z Score table Measures'[Z Score Table] <= 2 )),

3, CALCULATE ( [Actual Minutes], FILTER ( 'Z Score table Measures','Z Score table Measures'[Z Score Table] >= -3 && 'Z Score table Measures'[Z Score Table] <= 3))

)

Power BI Initiatives.pbix (1.3 MB)

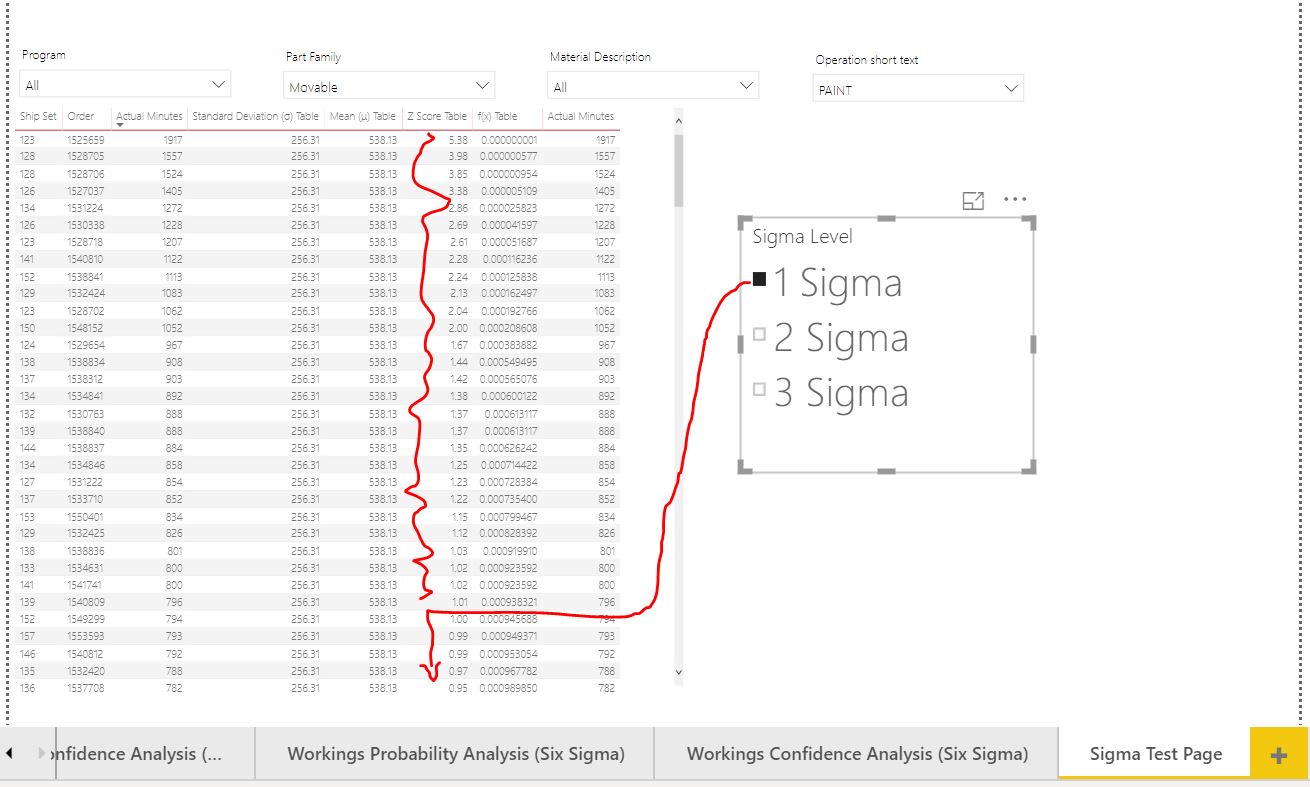
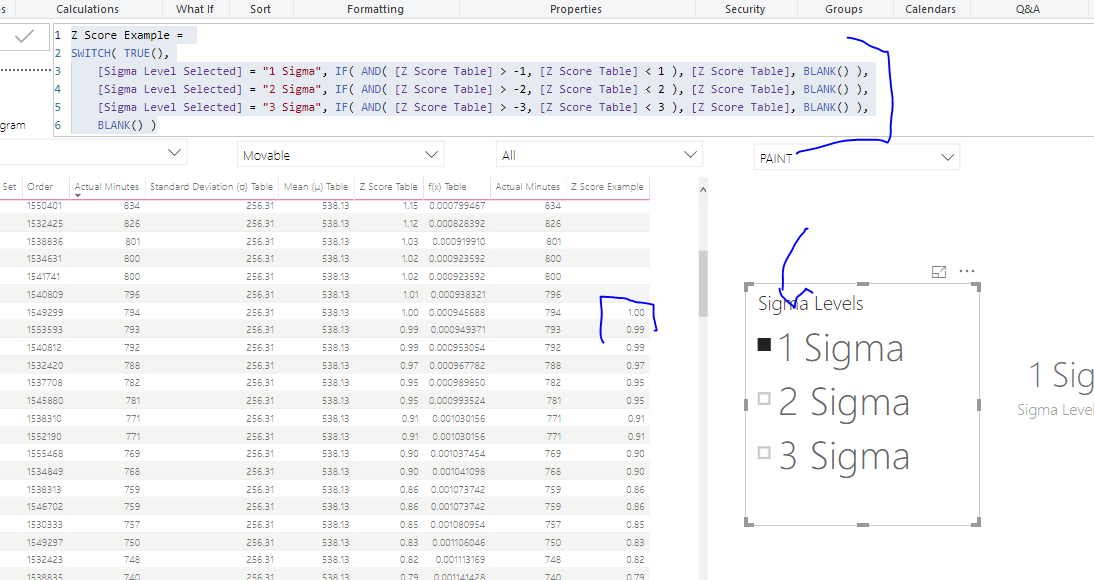
For example in below screen shot if 1 sigma is selected i dont want to see anything over 1 and below -1 as shown

Yes I like this idea here actually.

image

I understand it a bit more now based on this setup.

You could then use a SWITCH function with this.

Something like

Sigma Level Selected = SELECTEDVALUE( 'Sigma Level Example'[Sigma Levels], "3 Sigma" )

Z Score Example = 
SWITCH( TRUE(),
    [Sigma Level Selected] = "1 Sigma", IF( AND( [Z Score Table] > -1, [Z Score Table] < 1 ), [Z Score Table], BLANK() ),
    [Sigma Level Selected] = "2 Sigma", IF( AND( [Z Score Table] > -2, [Z Score Table] < 2 ), [Z Score Table], BLANK() ),
    [Sigma Level Selected] = "3 Sigma", IF( AND( [Z Score Table] > -3, [Z Score Table] < 3 ), [Z Score Table], BLANK() ),
    BLANK() )

One other thing I did was hard code the Sigma Level table.

Power BI Initiatives.pbix (1.3 MB)

See how you go with this

Sam

1 Like

Great stuff Sam many thanks mate.