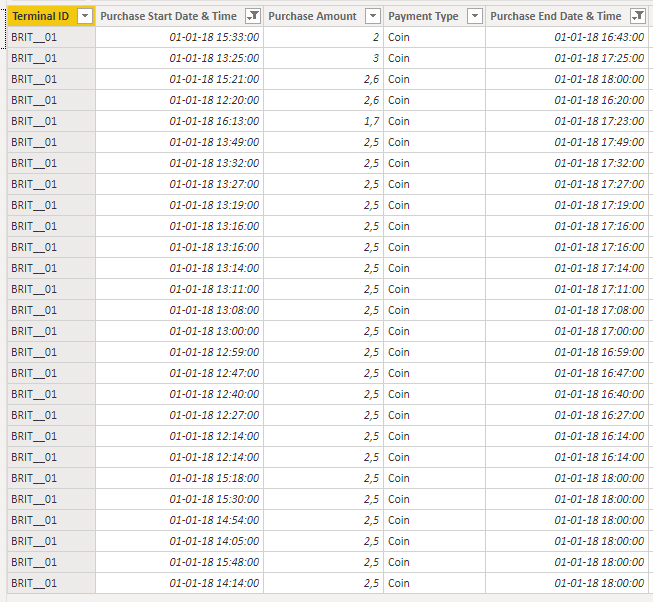
I have a fact table with columns that show the Purchase Start Date & Time of a vehicle entering a car park and another column that shows the Purchase End Date & Time. I have also split these out into Start Date, Start Time, End Date and End Time.
I need to produce a visual that shows the total occupancy over a day, week, month etc, and so I also have a Date and Time dimension table.
I’ve tried bringing these values into a line chart, but with no success, so I would imagine that I need to create a measure of some kind. Any ideas?
Hi @chrisgreenslade , we aim to consistently improve the topics being posted on the forum to help you in getting a strong solution faster. While waiting for a response, here are some tips so you can get the most out of the forum and other Enterprise DNA resources.
Use the forum search to discover if your query has been asked before by another member.
Use the proper category that best describes your topic
Provide as much context to a question as possible.
Include the masked demo pbix file and any other supporting links and details.
Hello @chrisgreenslade,
Even though you didn’t provide us with a pbix file that explains better what u r trying to achieve. i gave it a try and i hope this answers your question.
You can add a calculated column to your fact table to calculate the occupency (difference between end time and start time) if that’s what u mean by occupency.
to calculate this column use the function
DATEDIF ( start date time, end date time, Hour/Minute…)
the 3rd parametrs gives you the possibility to calculate the difference either in Minutes, Hours…
Her’s a PBIX file. Hope that answers the question. if so, please mark this as a solution
This helps to give me the purchase duration, but I need to be able to visualise the number of cars entering and leaving the car park at any one time. This is what I mean by occupancy.
Thanks for the file. What you have calculated is the total time duration for each vehicle that was in the car park that day.
However, what I need to do is work out the number of cars entering and leaving the car park over a period of time. For example, if 30 cars occupy the car park at 09:15 and then 2 were to leave at 09:17, the occupancy would be 28 at this time. A further 7 cars could then enter at 09:19 bringing the occupancy up to 35.
This is what I need to calculate. @Melissa are you or anyone else able to help too?
Few things to keep in mind. First limit the number of questions in a single thread, you can always create a new topic. Furthermore it will be extremely helpful to you if you take some time and create a full mockup model that resambles your actual production file. I can promise you that will lead to more accurate- and quicker responses from forum members.
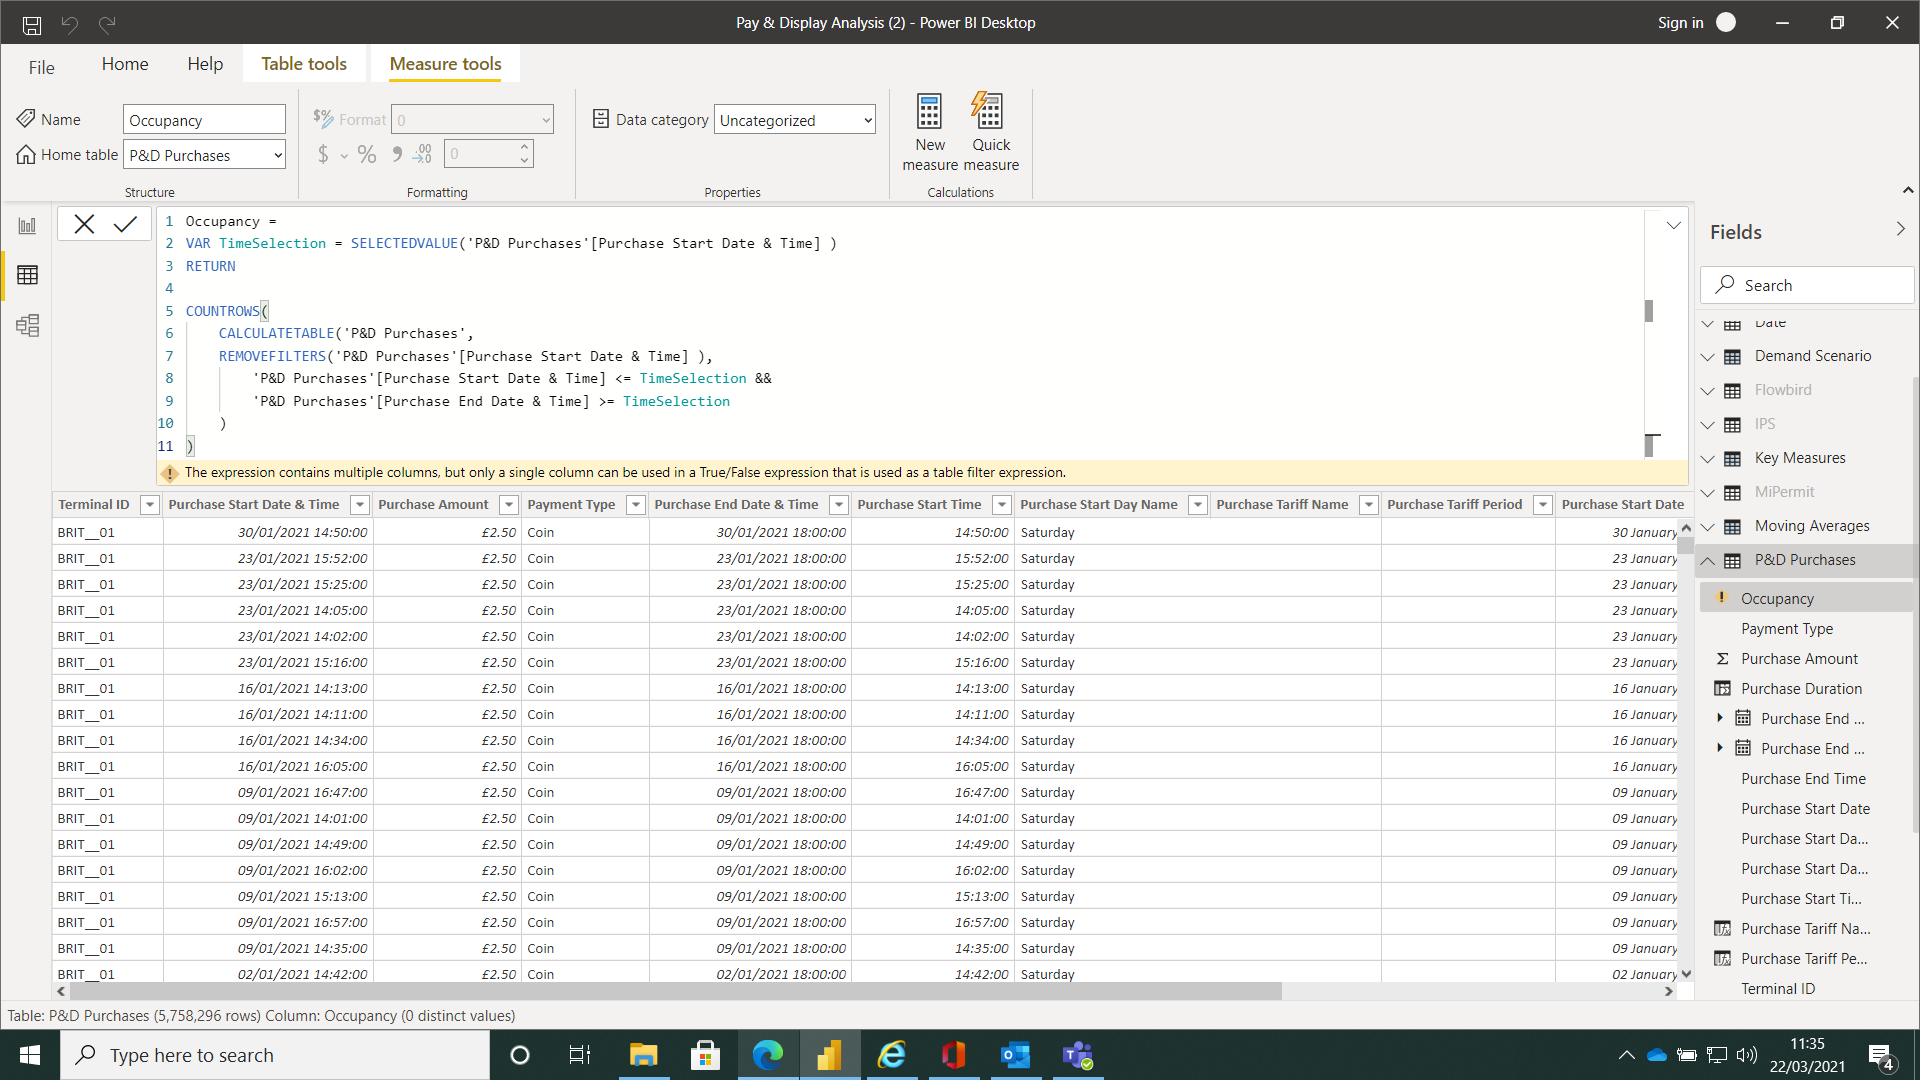
In your initial request you talked about visualizing these numbers in a line chart and I think this measure will allow you to do just that. Although keep in mind that because no model was provided, no dimensions were used…
Create a new report page
Select a Line Chart visual
Place the ‘P&D Purchases’[Purchase Start Date & Time] field on the Axis
and place the Occupancy measure in the Values section.
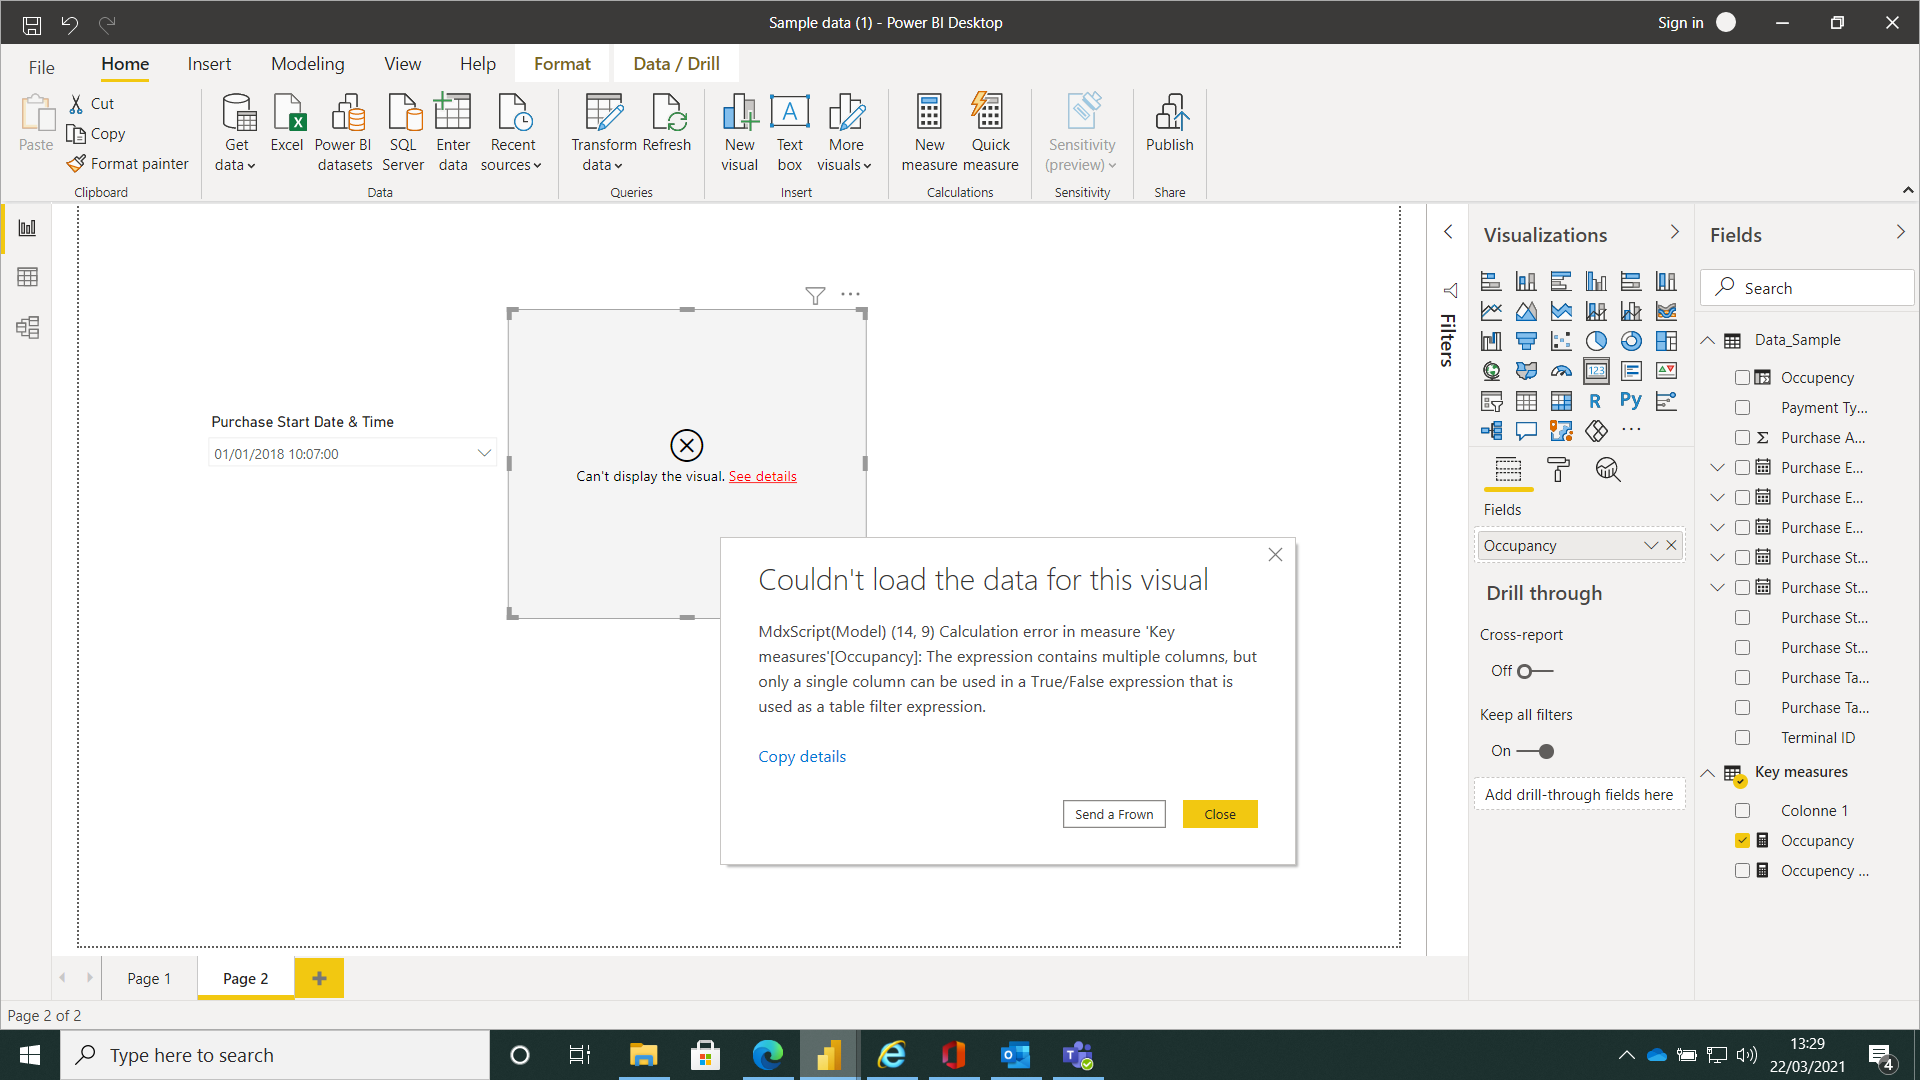
Thanks for your help. The visual is taking a long time to load and I am not sure it fully answers my question as you have zero occupancy between 18:00 and just after 06:00 the following day. Which is not the case in the sample data.
However, I have accepted it as a partial solution.