Creating a Static Card

Hi There

I have a fairly standard dashboard reporting on sales and other metrics. I want to have a set of KPI’s that report YTD, but don’t filter when other selections are made on the canvas. I have this working with “Edit Interactions”, but think this is fairly tedious.

I’m thinking there must be a simpler way!

So I have Total Sales = sum(sales) and have visual filters which are set up for Current Financial Year = Y, so only sales for this FY are calculated. I’ve set up a column in the date table for Current Financial Year = Y or N.

If I add other filters then I need to Edit Interactions so these do not filter on this card, but I’m thinking I should set the card metrics to be something like:
Card sales = Calculate ([Total Sales], FILTER(ALL SELECTED…

I’m looking for syntax that always calculates Total Sales for this FY regardless of what else happens on the canvas.

Any tips

Basically to get things like this to work you just need to ignore filters from anything that could be selected within a page.

To do this you need to use either ALL, ALLSELECTED or a combination of the two.

For you Current Financial Year example, you need to probably use ALL within the CALCULATE function, to totally ignore any selection made on this column you’ve created.

Then to get the actually financial year which is dynamic as time changes.

You’ll want to do something simple like

Current Financial Year =
CALCULATE( SELECTEDVALUE( Financial Year Column ),
FILTER( ALL( Dates ), Date Column = TODAY() )

Then this can become your filter within another calculation

CALCULATE( FYTD Calc,
FILTER( ALL(Dates), Financial Year Column = Current Financial Year )

Hopefully this makes it clear how I would do this.

Thanks Sam

This half works - bit strange really.
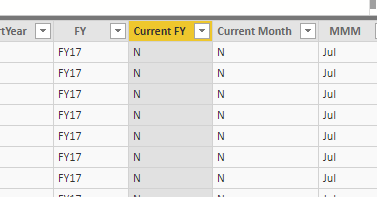
We receive the Date flags from another system, so they flag “Date[Current FY]” = “Y” and "Date[Current Month] = “Y”. This, in theory, would mean that we are consistent across those two dimensions with other systems.
I was hoping then, that on the dashboard we would report a series of cards for YTD and Current Month that show the primary KPI’s and remain static while Date selections are made across the rest of the metrics. Allow the user to dig around while keeping the primary measures close to mind. Sometimes the user gets lost in the drilling and filtering.

So to do that I tried two measures:
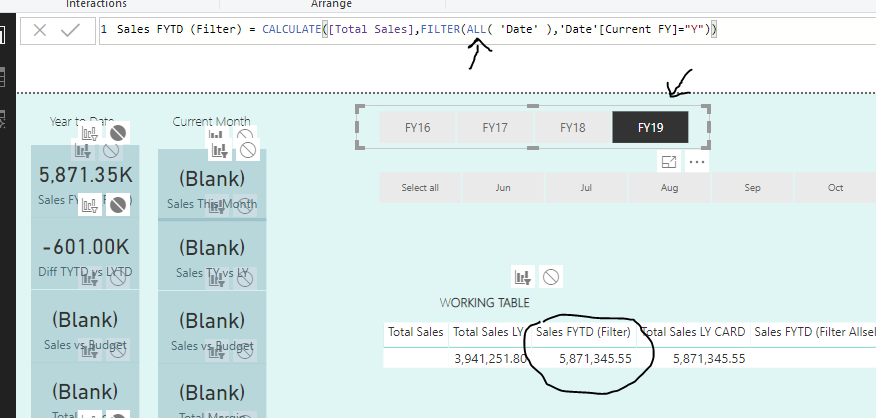
A) Sales FYTD (Filter) = CALCULATE([Total Sales],FILTER(‘Date’,‘Date’[Current FY]=“Y”))

B) Sales FYTD (Filter) = CALCULATE([Total Sales],FILTER(‘Date’,‘Date’[Current FY]=“Y”))

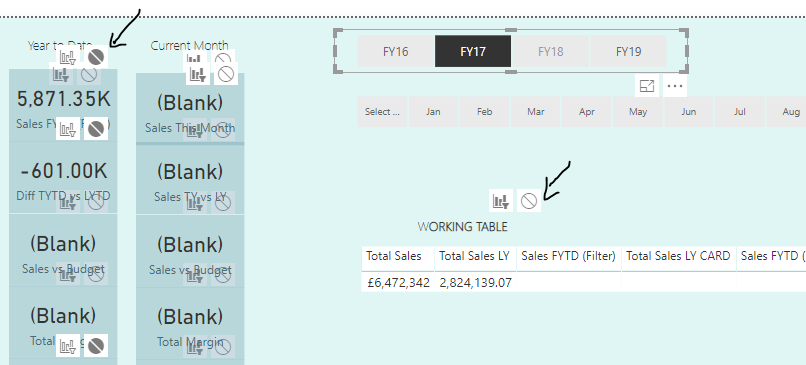
Now A all the time and B is intermittent. So on the dashboard, attached below, if I choose different dates from the slider, A as a card (TOP LHS) remains constant which is good, but B, in the Working Table is only correct when the correct year is chosen.

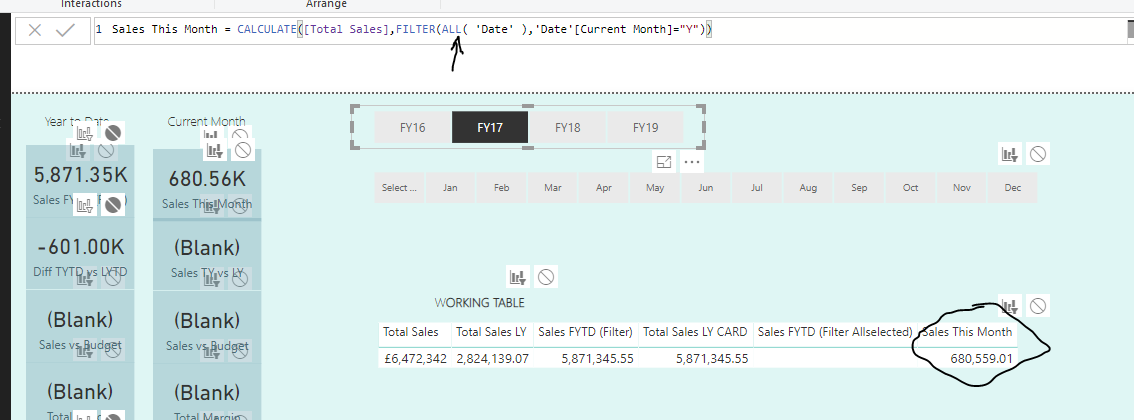
That would be OK but when I try to create the same logic for Current Month, using the syntax for A, I try:

Sales This Month = CALCULATE([Total Sales],FILTER(‘Date’,‘Date’[Current Month]=“Y”))

which swaps Current Year for Current Month, and it doesn’t calculate the same as for YTD. If I select the current Month Year (March FY 18) it is correct as shown in the Working Table and the top card in Current Month. If I change the Month Year combination it becomes Blank.

Not sure what is wrong with the syntax?

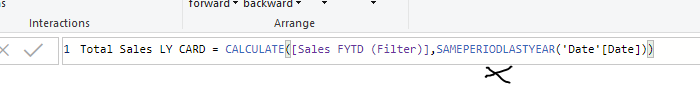
Then when I try Sales same period last year it all goes wrong. I have this:
Total Sales LY CARD = CALCULATE([Sales FYTD (Filter)],SAMEPERIODLASTYEAR(‘Date’[Date]))

I call it CARD as I know I will need dynamic measures as well as Card specific measures. I thought that BI would know the dates it used in CALCULATE([Sales FYTD… and look for the same dates last year but apparently not. I also tried DATEADD -1 Year, but no luck there.

Card Example.pbix (2.1 MB)

Make sense?

Sorry in above B is
Sales FYTD (Filter Allselected) = CALCULATE([Total Sales],filter(ALLSELECTED(‘Date’),‘Date’[Current FY]=“Y”))

From what I can see in the example the main reason they results aren’t the same between the card and the table is because of the ‘interactions’ that have been set up between the visuals.

See below

These would need to be the same.

The reason there is also odd behaviour between these is all because of the context being created when selections are being made in the slicers.

You can simply create a static card like you have already done.

image

This is fine is that’s what you want, but it might not always work especially if you want to use the calculations is some other way (ie. not in a card)

If you want to always show the total sales just for the current year, no matter what selection is made then you have to use ALL.

Like the below.

You see now, whatever is selected, it doesn’t matter, because the ALL will always ignore any selection and only return the current FY within the FILTER function.

This would be exactly the same for the current month

With the time intelligence and SAMEPERIODLASTYEAR. This unfortunately will not work because this is also changing based on the selections being made.

For this I would probably recommend adding another column in your table for Last FY and using a similar technique with your measures.

image

You could likely work this out in measures, but I think this way would be much simpler and easier to implement.

See how you go with this.

Sam

Interesting Sam, thanks

I put the Date Indicators in different columns and it works fine, but I think a refinement is to put them into the a new column with different flags - something like “Y”, Current Year; “Y-1” prior year; etc etc. And same for month.

Something else cropped up, which might be a learn for me.

I used the syntax pattern FYTD Sales = CALCULATE([Total Sales],FILTER(All(‘Date’),‘Date’[Current FY]=“Y”)) for all the calculations, and all was good.

I then added a Product Category Slicer to the dashboard, and this (obviously now) overrides the ALL from Dates pattern above. Am I right then that ALL (Table) just works for that Table and other filters applied have a filtering impact on that measure. There is no syntax that says - “Just Calculate the Total and leave it be”.

So you just can’t get a Grand Totals set of metrics that don’t change. I assume that is something you need to do with Interactions as shown above. Or safer to create a totals table as part of the loading process so it never changes.

If so this is where the Data Model design starts to become pretty important and something I need to give more consideration to.

Yes your correct, the ALL( table ) will only impact the filters coming from that table.

Filters that come from anywhere else like products in your example will still impact the calculation.

You would need to include an ALL( Products ) to the came formula, to remove filters from here also.

One thing to remember with this is to label your measure very appropriately, because if users are making slicers selections on a page and then not see any changes to results, that can be confusing unless it’s very clear what each results is.

Thanks Sam