I’m at my wits end trying to figure out the best way to group data based on date past due for a specific time-frame. I have a dataset where customers with unpaid invoices needs to be grouped by “4 weeks or more” and “3 weeks or less”. The catch is that one customer may have many due dates less than 3 weeks but if 1 entry alone is 4 weeks or older, the customer should appear on the “4 weeks or more” group… .
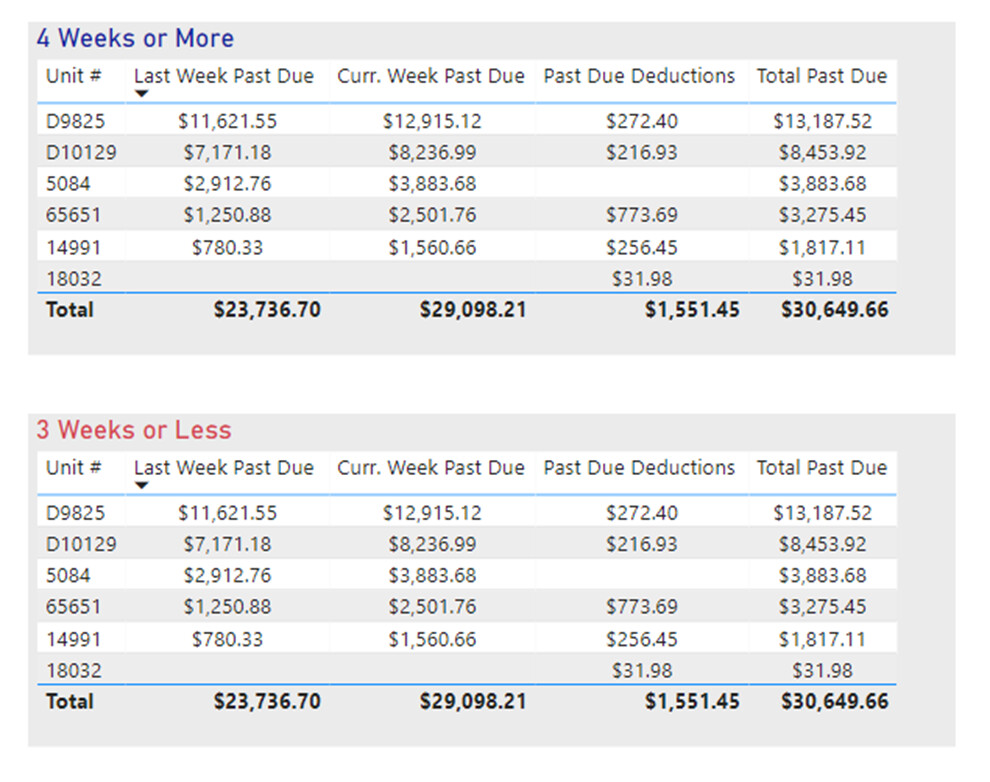
This is what I have now in BI… as you can see both tables show the same customers.:
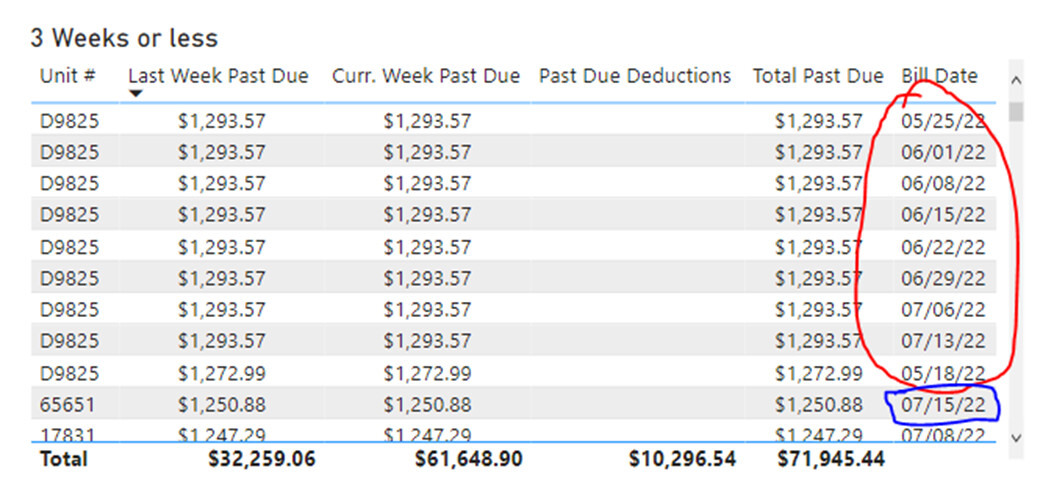
If I add the date to the table its easy to see which customer should appear on the 3 week and 4 week table. The customer circled in red should appear on the 4 weeks table and the one in blue needs to appear on the 3 weeks table.
I imagined creating a calculated column where a Yes or No would determine where each customer belongs by using the column as a filter in the visual. But I don’t know how to calculate this since there are many different dates per user. I suspect the MIN I tested with various formulas but couldn’t get to the correct one.
Or maybe Dax will suffice?
Either this is a very advanced formula or, so easy that the answer flew right over my head.
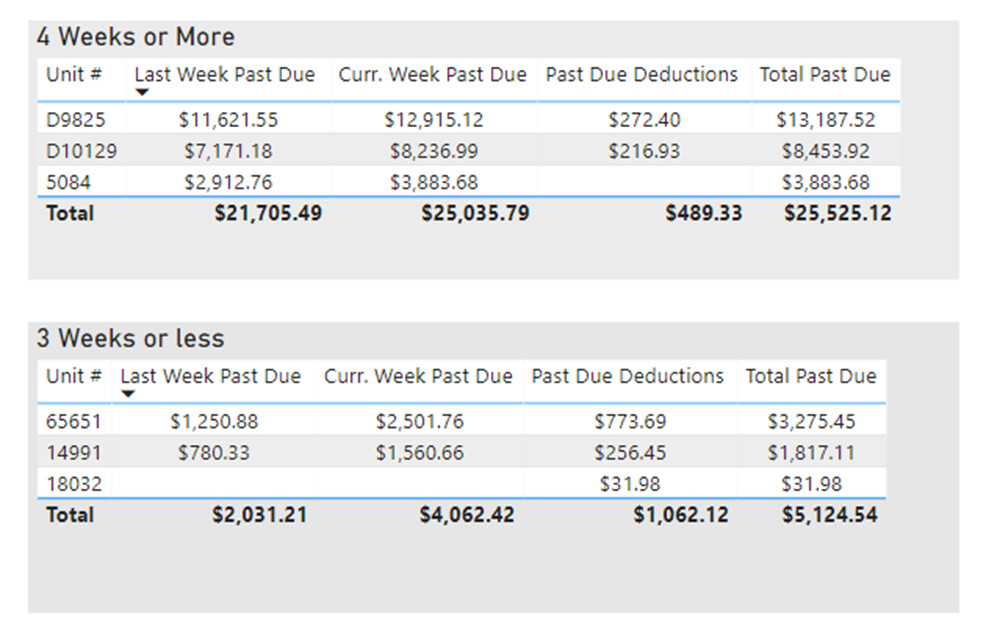
Now, once you create this measure, select the table and put it inside a Filter Pane under the section - “Filter on this visual” and apply filters as “Is Greater Than Or Equal To 4” and on the next visual apply the filters as “Is Less Than Or Equal To 3”. And you’ll get the results as expected. Below is the screenshot of the final results provided for the reference -
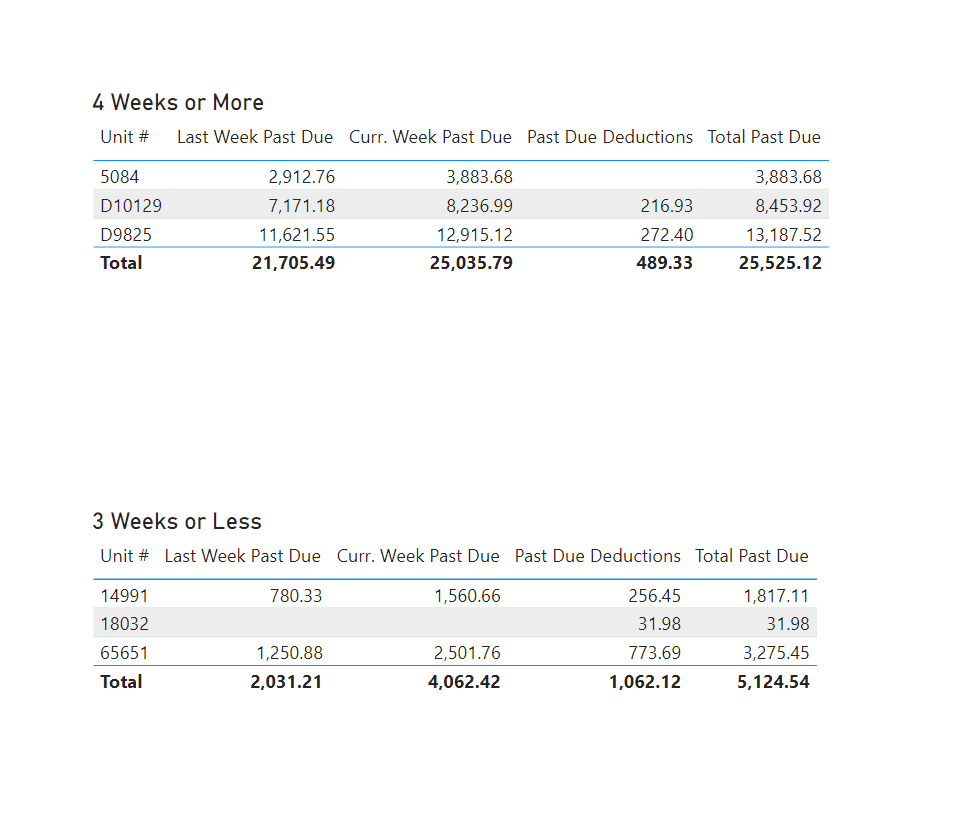
@Harsh Thank you so much! The result in my dataset was perfect! This is nothing like what I was trying to do but looking at it now it should have been obvious to me! My lack of logic regarding Dax is so frustrating sometimes