I am trying to create a Dax measure that will include all R12 customers that meet/exceed the threshold., need to include details of the purchase. See Attached pbix file
I have the calc for that works for counts - this achieves the expected results for the line chart
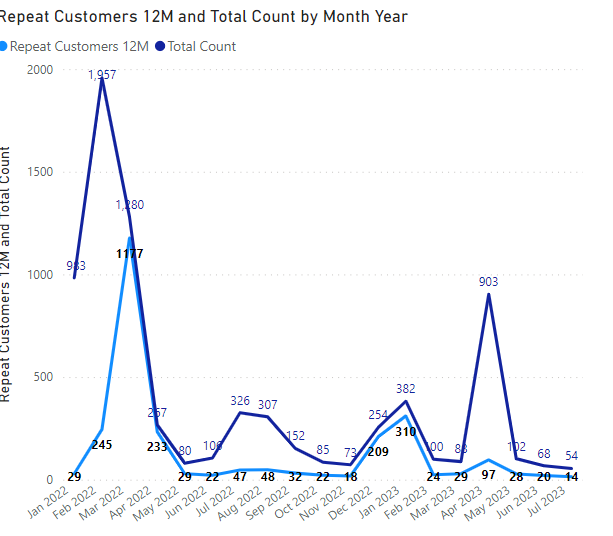
Repeat Customers 12M =
VAR _Threshold = 2
VAR _Rolling12Customers =
ADDCOLUMNS(
VALUES(‘Fact’[Customer ID])
,“Counts”, [R12 Count]
)
VAR _CustomersOverThreshold =
FILTER(
_Rolling12Customers
,[R12 Count] >= _Threshold
)
VAR Result =
COUNTROWS(_CustomersOverThreshold)
RETURN
Result
This calcs does not allow me to create a table visual of the Customers that meet the threshold to include Customer ID, , store, product. As the Store and Product can be different on each purchase
As below, the first table represents adding customer ID,
second table represents adding product

Goal is to create a visualization similar to this - This would allow me to do a deep diver into stores,/
JHC R12 Customer above threshold.pbix (150.0 KB)
Products

Thanks!
Jhc