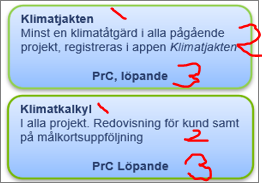
I am trying to create the following visual. Example: When a user selects Klimat, then I need to create two cards - one for Klimatjakten and the other for Klimatkalkyl. Each card would also have two other fields - Field 2 and Field 3. Tried with Multi-row card and other visuals in Microsoft App Store, but did not succeed. Even if it is not possible to have 2 different cards, can I atleast get each field in each row instead of multiple columns in the card? Thanks for your help!
Another option instead of using a card would be the Smart Narrative feature. @Greg did a recent YouTube video to help guide you how to use it. I suggest you check it out.
If you sign up for a pro license for OKVIZ KPI cards you might be able to do this. You can use the slicer column as small multiple in the visual and then use the slicer to control the # of cards
It’s great to know that you are making progress with your query @DebSJ! Please don’t forget if your question has been answered within the forum it is important to mark your thread as ‘solved’. Also, we’ve recently launched the Enterprise DNA Forum User Experience Survey, please feel free to answer it and give your insights on how we can further improve the Support forum. Thanks!
Hi, thank you for your guidance. Dynamic narratives is really a good solution to use. User would also like to have background coloring or a flag based on satisfying a condition. I somehow get a feeling that maybe I should also look into KPI scorecard tracking or Goals Microsoft launched yesterday to achieve this purpose.
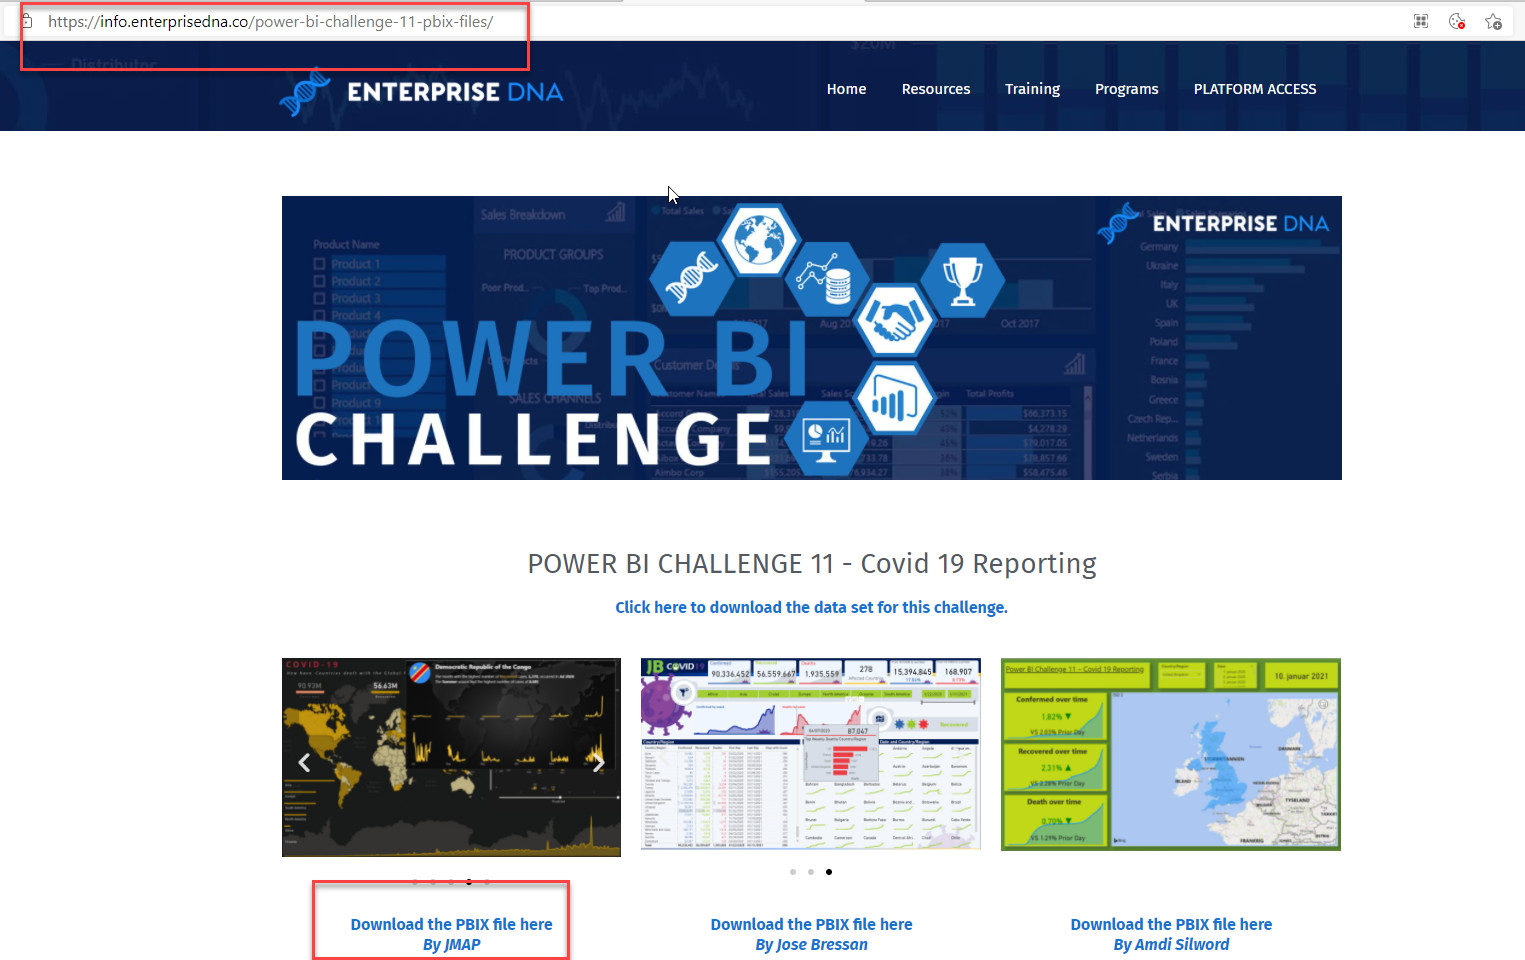
Just a reminder that Goals is a premium feature only right now. I’m sure you can get the smart narrative to do just about whatever you want it to do. Have a look at any of @Greg entries for the Challenges, or the JMAP entries for Challenge 11 & 12 to see them in action. If one of our responses works, please mark as solution.
Just mindblowing visuals in the JMAP challenge 11 and 12. Well, I am a novice in that sense. Can you please advise or provide reference as to how to do conditional formatting of the text in narrative format? The JMAP PBI file is not downloadable, so not able to se the underlying tricks involved. But absolute kudos!


 Need to bookmark these links, as I am a new member of Enterprise DNA portal.