Create a table to count the color in a conditional formatting

Hello,

I have a measure for percentage of employees attending. I have made conditional formatting on the measure to show on a table if the percentage of employees are less than 40% or 50% or 75% or 90% at a building . I have given 4 sets of colors for each of those ranges.

However, I now need to provide a table that does count of employees that are in each of those colors. Is there a way to calculate ranges from a measure to provide counts of the colors? Or is there another way to do this. Please let me know.

Hello @supergallagher25,

Thank You for posting your query onto the Forum.

Can you please provide the PBIX file alongwith the the exact and specific conditions that you’re trying to use it in your formula?

Thanks and Warm Regards,
Harsh

Hello,

Thank you so much for your time. I am attaching the file here.
This is how my current conditional formatting looks.


I am trying to bring a count of employees in each of the colors in a different table.
sample_Conditionalformat.pbix (132.0 KB)

Hello @supergallagher25,

Just have a query regarding the % of Employees.

From this do you want to see how many employees that are currently employed in the organisation?

A little bit of explanation will help here to achieve the desired result.

Thanks and Warm Regards,
Harsh

image

Hello @supergallagher25,

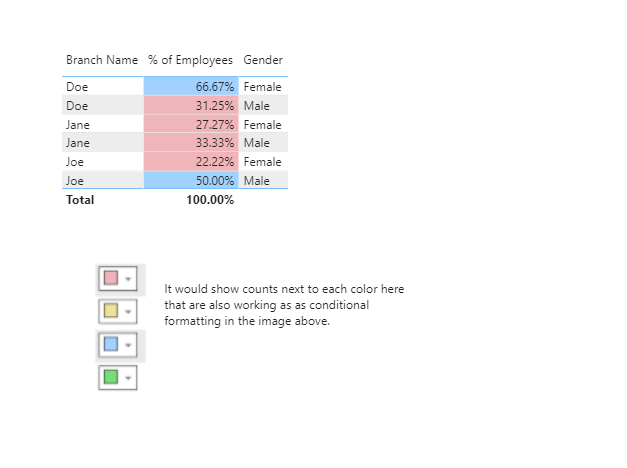
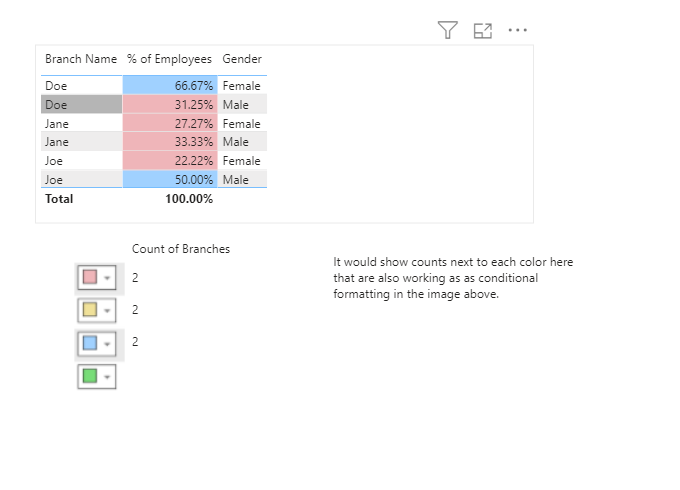
Is this the result that you’re looking for? Below is the screenshot provided for the reference -

Count of Employees - 1

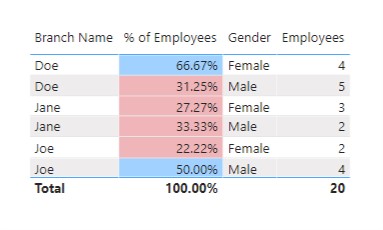
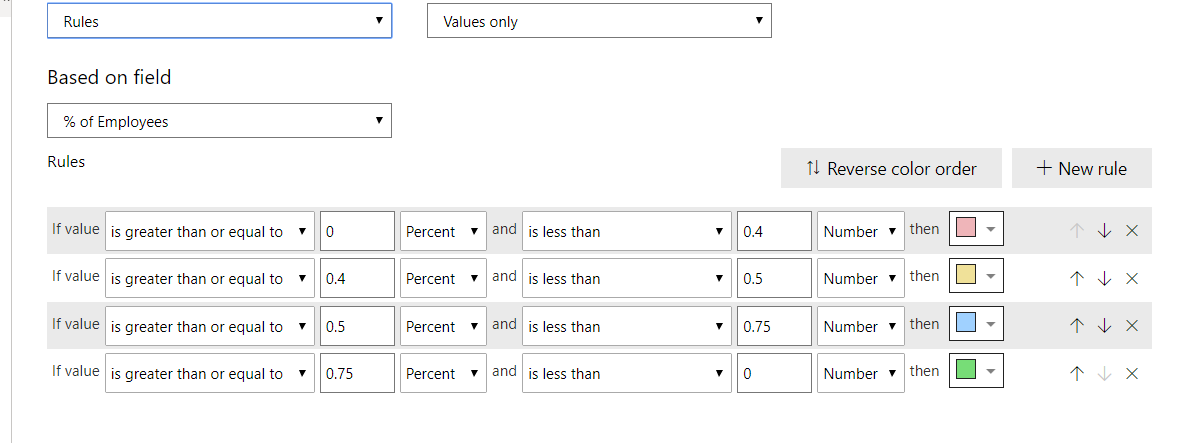
So I’ve just placed the measure into the table that you’ve already calculated. Below is the measure provided for the reference -

Employees = 
CALCULATE( DISTINCTCOUNT( tEmployee[EmpID] ) ,
    FILTER( VALUES( tEmployee[Enter Date] ) , tEmployee[Enter Date] <= MAX( Dates[Date] ) ) ,
    FILTER( VALUES( tEmployee[Leave Date] ) , tEmployee[Leave Date] >= MIN( Dates[Date] ) ) )

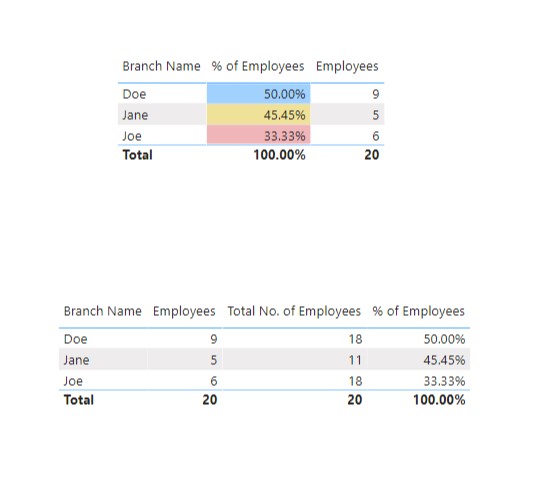
But to understand it in a much better way how 66.67% includes 4 employees I just added one more formula into the kitty. Below is the formula provided for the reference -

Total No. of Employees = 
CALCULATE( DISTINCTCOUNT( tEmployee[EmpID] ) , ALLSELECTED( tEmployee ) ,
    FILTER( VALUES( tEmployee[Enter Date] ) , tEmployee[Enter Date] <= MAX( Dates[Date] ) ) ,
    FILTER( VALUES( tEmployee[Leave Date] ) , tEmployee[Leave Date] >= MIN( Dates[Date] ) ) )

So actually, here how it calculated 66.67% where it includes 4 of the employees. Below is the screenshot provided for the reference -

Count of Employees - 2

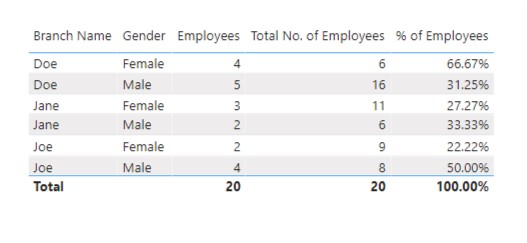
Now, if you observe, it’s actually 4/6 = 66.67%. So 4 represents the current number of female employees employed in that particular branch whereas 6 represents the overall number of female employees employed till date. Resultant figure = 66.67%

And this is what I was trying to check with you that do you want to see the current numbers of employees working in your organization.

I’m also attaching the working of the PBIX file for the reference.

Hoping you find this useful and meets your requirements that you’ve been looking for. :slightly_smiling_face:

Thanks and Warm Regards,
Harsh

sample_Conditionalformat.pbix (132.8 KB)

Thank you, and if I want to get a count of the Branches that are red or blue as the image posted above (% of Employee), how would I be doing that?

Hello @supergallagher25,

If I want to get a count of the Branches that are red or blue as the image posted above (% of Employee), how would I be doing that? - So do you mean that only Branch names and no gender wise bifurcation in it as shown in the above screenshot. Then in that just remove the gender from the table and you shall have the consolidated result. Below is the screenshot provided for the reference -

Count of Employees - 3

Thanks and Warm Regards,
Harsh

sample_Conditionalformat.pbix (133.8 KB)

I apologize, I guess I am not being able to explain clearly. I was trying to show it this way, how can I do the counts for them this way?
image

Hello @supergallagher25,

Now I guess I’m starting to get a bit confused here.

Actually where do you wish to put/show these numbers. Is it somewhere on the conditional formatting page. As per provided the screenshot provided below -

Or is it in the table somewhere you want to show those numbers.

I’m not able to understand the requirement here.

Thanks and Warm Regards,
Harsh

Thanks for posting your question @supergallagher25. To receive resolution in a timely manner please make sure that you provide all the necessary details on this thread.

Here is a potential list of additional information to include in this thread; demo pbix file, images of the entire scenario you are dealing with, screenshot of the data model, details of how you want to visualize a result, and any other supporting links and details.

Including all of the above will likely enable a quick solution to your question.

Hi @supergallagher25, we’ve noticed that no response has been received from you since the 17th of September. We just want to check if you still need further help with this post? In case there won’t be any activity on it in the next few days, we’ll be tagging this post as Solved. If you have a follow question or concern related to this topic, please remove the Solution tag first by clicking the three dots beside Reply and then untick the checkbox. Thanks!

Hey Harsh,

I apologize for the delay, I was trying to bring in the colors as an image in the visual and show the count of Branches next to it. I figured it out, I created a conditional column on to create the calculations. Thank you so much for your help on this, I didn’t mean to complicate things.