Sam: great work. Can you please either share the file or create a follow-up post to expound on the details of the model? Thanks.
IG
There is already actually a detailed workshop on the specific subject. It is in the scenario method workshops module.
See below
Sam
Please let us know if there’s ever a way to size the columns faster.
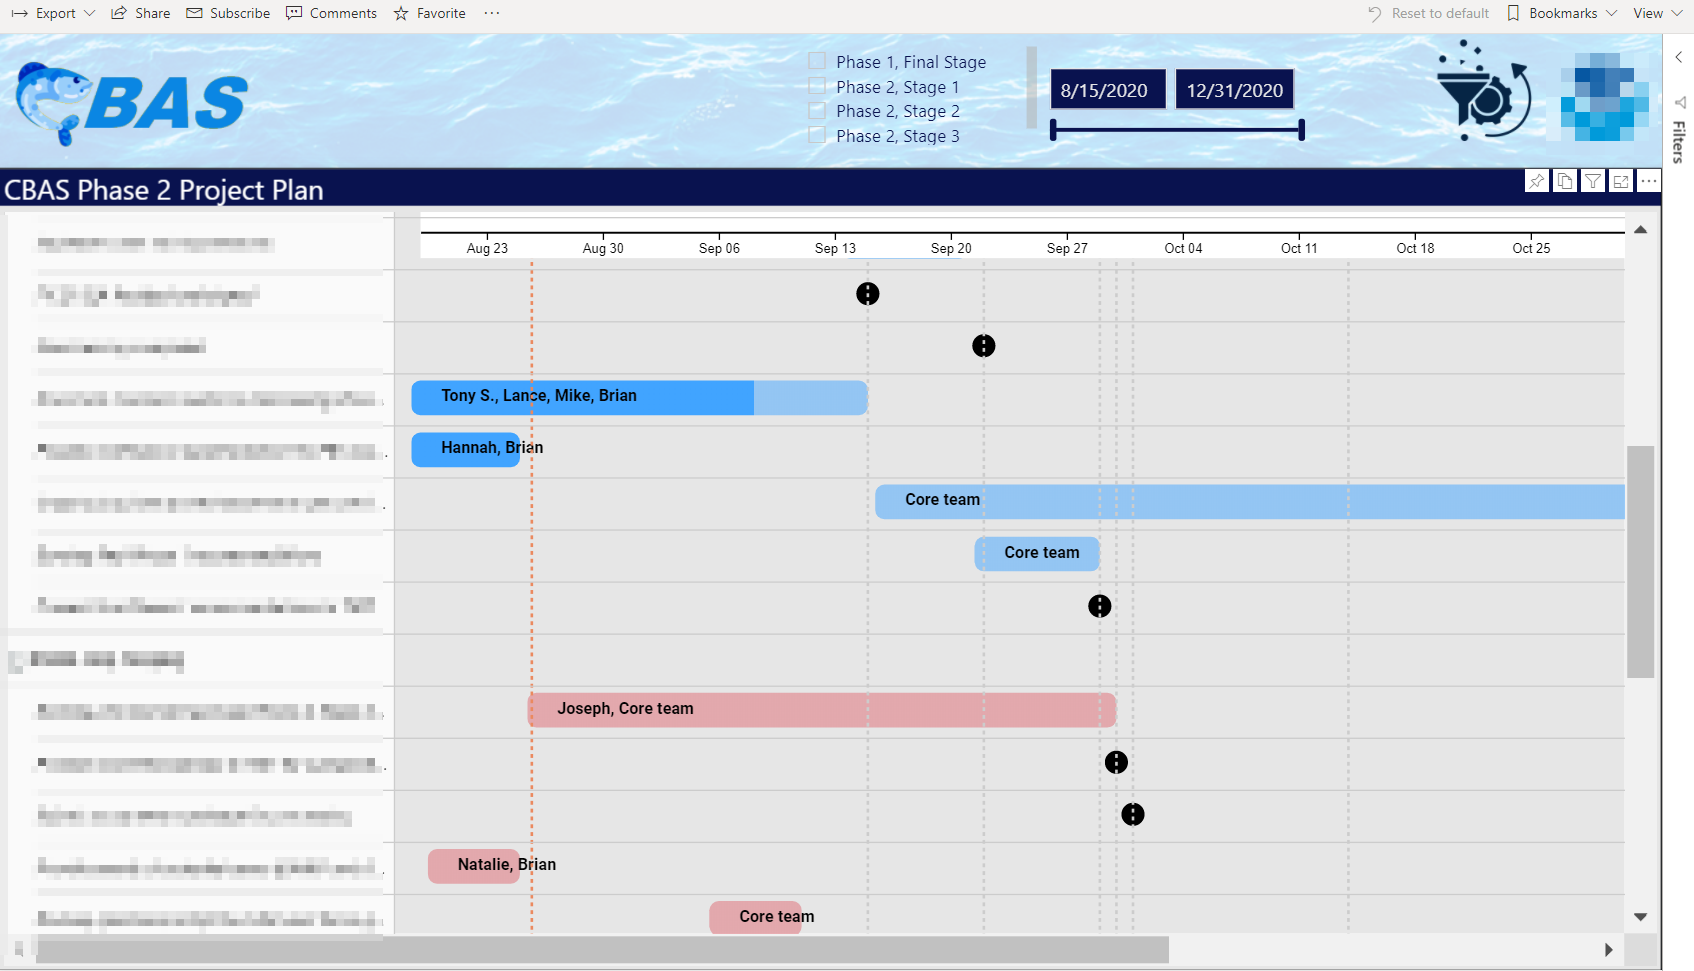
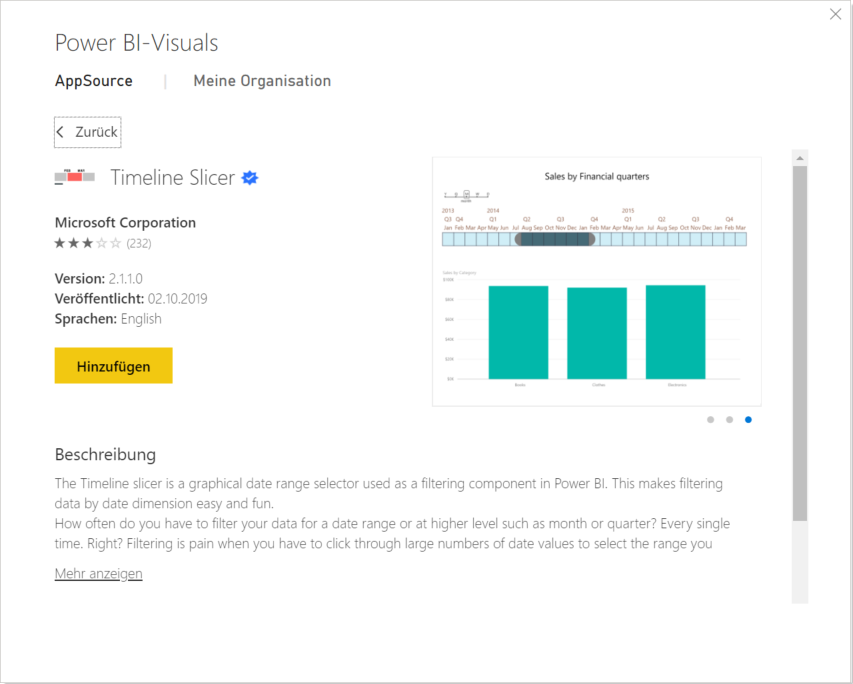
There is a Gantt chart visual availble in the custom visuals marketplace. It’s for free and it’s from Microsoft, so you can trust it. I like it. There is also a custom date slicer from Microsoft that fits well with the Gantt chart. Give it a try.
Totally endorse @Martin’s recommendation here. I use the Microsoft Gantt custom visual for managing and reporting on a number of my projects. A lot of nice features including a dynamic today line, custom milestone markers, robust tooltips, ability to assign resources to tasks and track % complete by task.
I will warn you that there is some mild wonkiness that still need some debugging – for example, the resource labels in my desktop client version are set to appear to the right of the task bars, but when I publish to the service they move inside the bars. I also can’t get rid of the time in the tooltip, despite the fact that my date field is date only, not date/time. But these are pretty minor, and overall it’s a lot easier than building it out yourself from a matrix visual.
@Martin - what’s the date slicer you reference that you use in conjunction with this visual?
I hope this is helpful.
– Brian
I have bought a paid subscription howet finding a hard time signing up to this course as it’s not letting me enroll, please help as I need to learn on matrix gantt
Hi @rid1 ,
Thank you for reaching out.
We have responded to your email sent to our Customer Support Team and have provided you with access to the updated content available in EDNA Learn.
Let us know if you need any further assistance!
Kind regards,
Enterprise DNA Support Team