Create a dynamic visual that displays the selections in slicers

Hi
I have 20 slicers in the report and I would like to display in a separate visual the values that were selected in each slicer (could be a multiple selection as well).
I wrote a measure for per each slicer and put them in a matrix.
An example with 2 slicers:
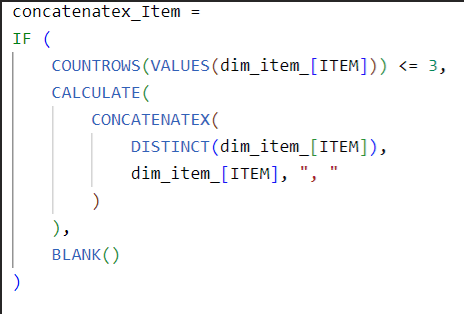
image

I get the result:
image

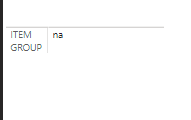
How to not show the name of the slicer if nothing was selected?

Thank you,
Tamir

Hi @Tamiri ,

Welcome back to Forum.

Maybe just filter the table to show what are expected?

I ran this question through a new agents functionality in data mentor

It’s quite a detailed response that I got and I think you’ll find it interesting from a learning perspective.

You can also carry on the thread if you like

1 Like