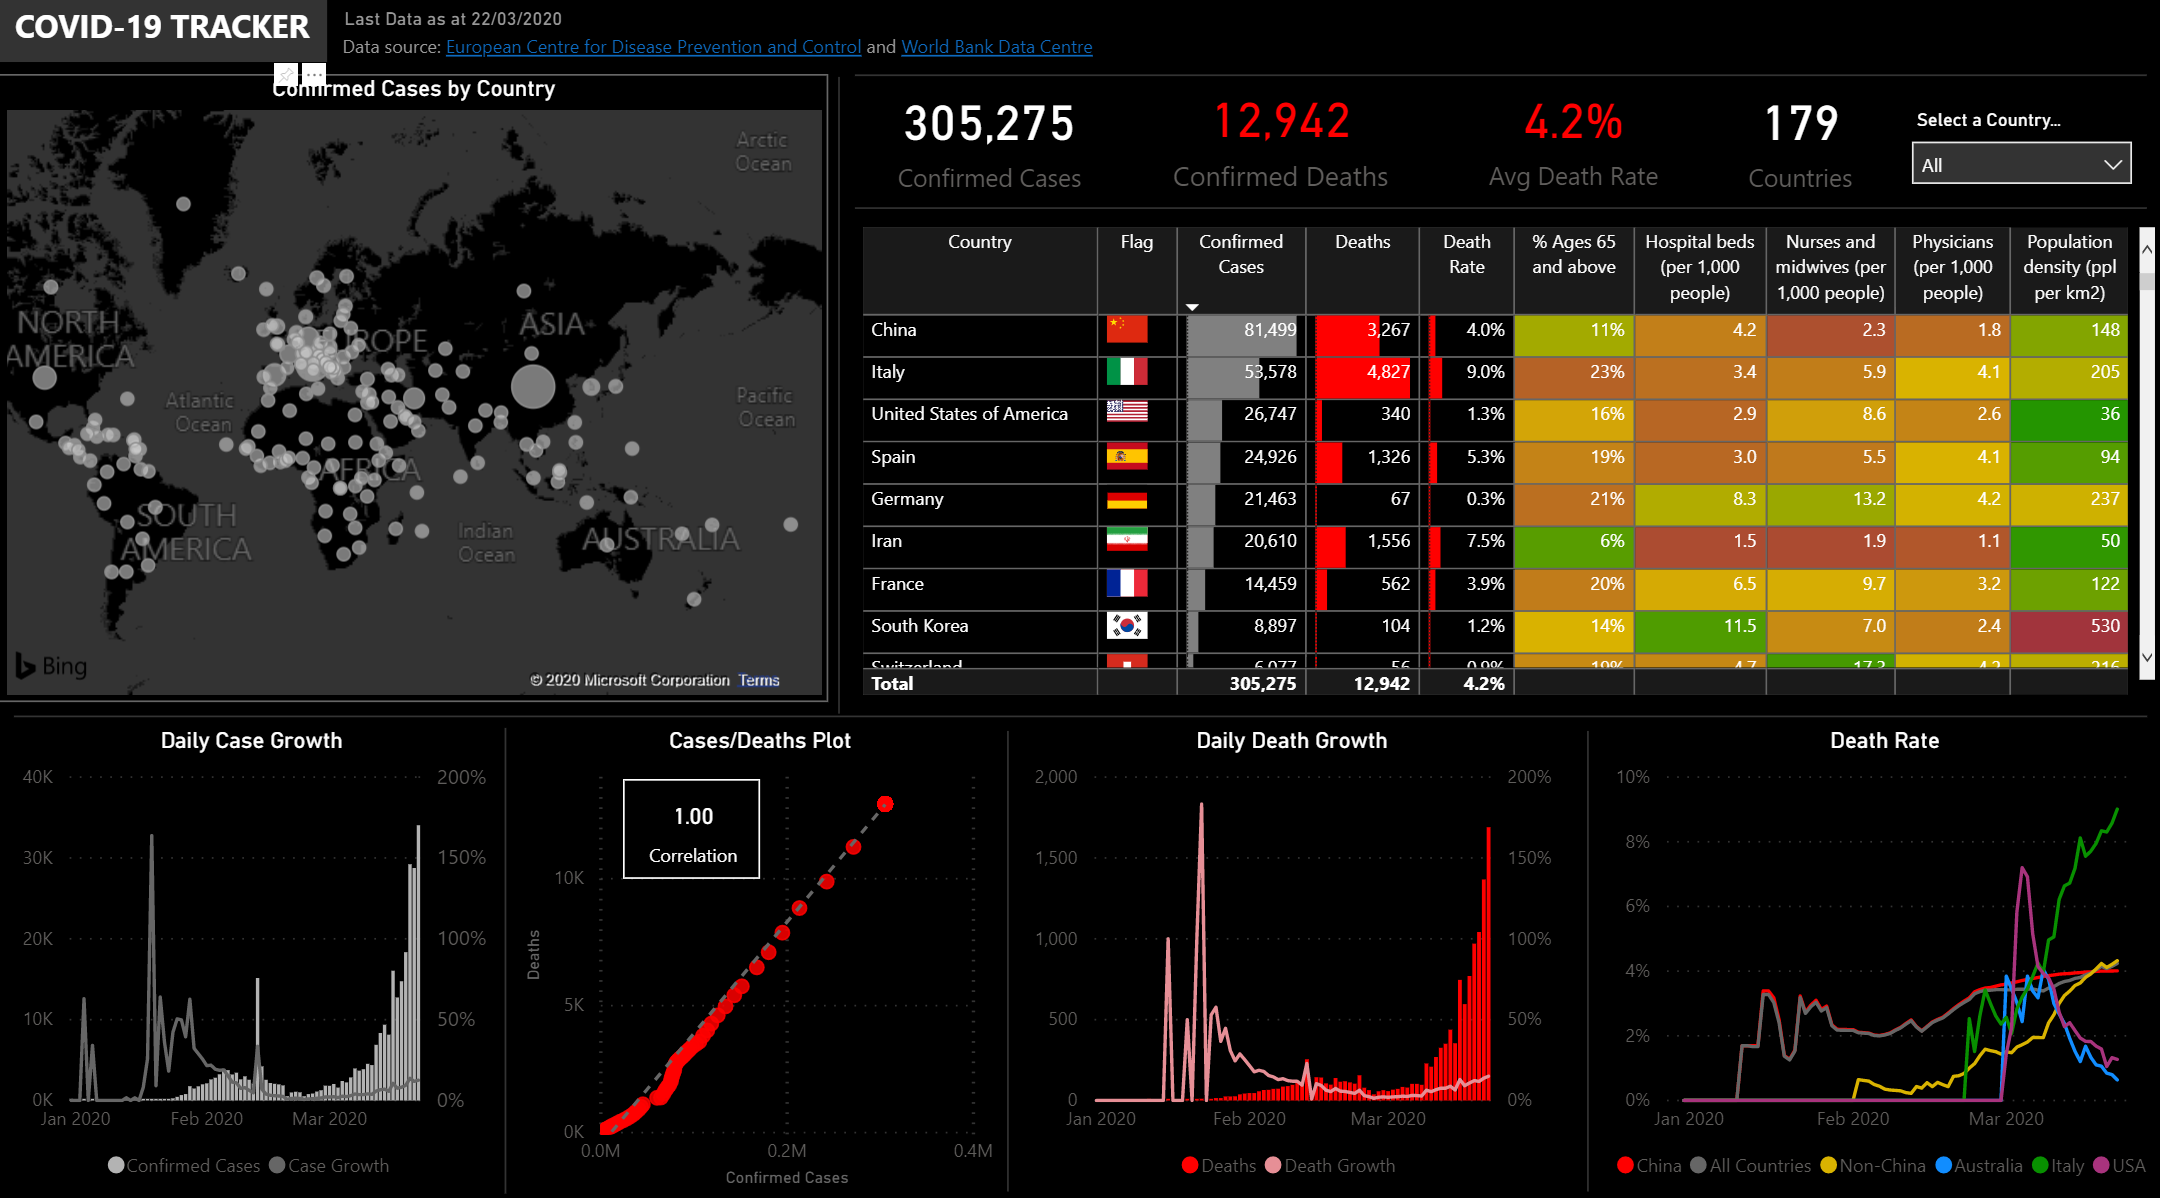
I have been working on a Covid -19 data model based on information from European Disease Prevention Centre. The data is presented in daily new cases and deaths, not total cases. Please see attached my model and source files.
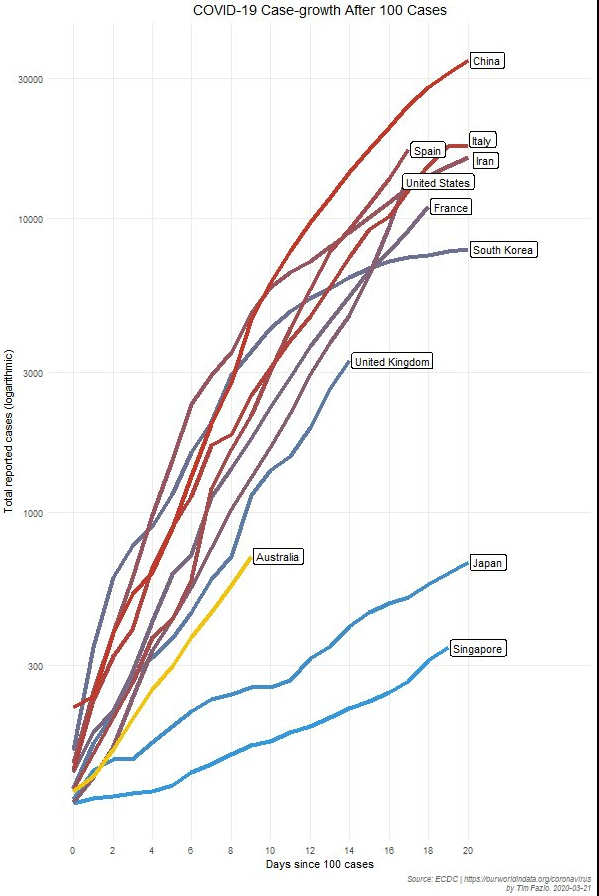
Recently I found a nice chart on an article and am triggered to replicate as it would be nice to show the speed the cases have grown since the first 100 cases.
Hi Brian,
It’s great! Now I grasp the idea of how to make it work.
I still have a problem though, the dataset used in the Youtube video is running total of confirmed case. While my dataset is NEW case daily. Do you know how to create a running total calculated column in Power BI (either DAX column or M)?
Thanks.
Yes I know these cumulative measures. However, it is measure. Whereas in this case I need a calculated column rather than a measure in the data table in order to show the 100th case chart.
I’ve searched a lot but apparently there’s no way to create a running total calculated column…
Just FYI - for those of you interested in doing your own COVID-19 analyses in Power BI, Gil Raviv had an outstanding post on his site this week on this topic, focused on how to prep the data in Power Query:
Hi @kbi, a response on this post has been tagged as “Solution”. If you have a follow question or concern related to this topic, please remove the Solution tag first by clicking the three dots beside Reply and then untick the check box. Thanks!