Counts ID if id has values in more than 1 value in a different column

Hello,

I am trying to count ID’s that have a “D or F” in more than 1 or more subjects.
I have the following table,
image

& I have created the following visual. I am trying to create a column/measure that counts the ID if they have have a “D or F” in English and Math or even English, Math and Science. I am also trying to create a column that holds " English and Math" & “English, Math & Science” as values. I am trying to insert a table that would hold those values underneath the table in the image below and calculate their f%. I tried creating conditional columns to separate subjects and then doing an unpivot but realized that it was creating duplicate ID’s and also each ID has subject in a different row. Any help would be appreciated.
image

I am also attaching the file below here.
failing_courses.pbix (27.7 KB)

@supergallagher25,

Give this a go:

Count Failing Multiple =

VAR vTable =
    ADDCOLUMNS (
        SUMMARIZE ( 'Table', 'Table'[ID] ),
        "@TotFails", CALCULATE ( SUM ( 'Table'[Fail] ), ALLEXCEPT ( 'Table', 'Table'[ID] ) )
    )
VAR Result =
    CALCULATETABLE (
        FILTER ( vTable, [@TotFails] >= 2 ),
        ALLEXCEPT ( 'Table', 'Table'[ID] )
    )
RETURN
    COUNTROWS ( Result )

image

II hope this is helpful. Full solution file attached below.

Brian,

Thank you again for your time, but I am actually trying to create a table underneath and it would look exactly as the table on top, which is where I am struggling in trying to get the counts. I am attaching an example screenshot here,

image

@supergallagher25,

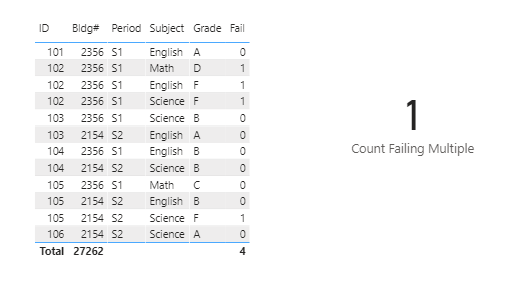
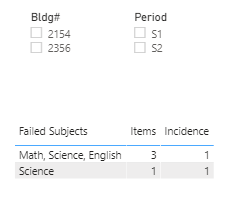
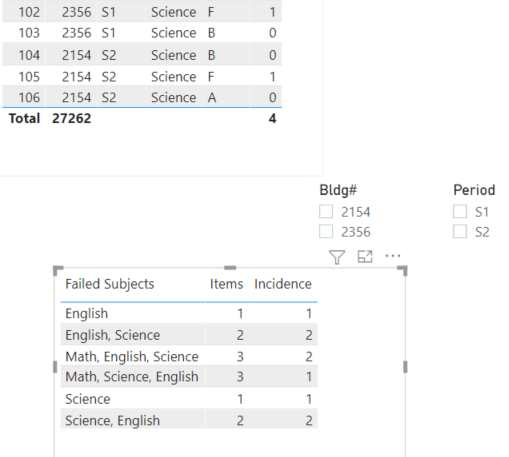
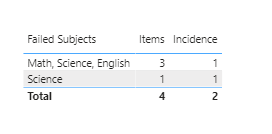
Thanks very much for the clarification, which made me realize this is much better done via Power Query than DAX. I produced the full results below, but if you only want to show rows with multiple items, you can add a final step in PQ to filter out any rows where Items = 1.

image

let
    Source = Table.FromRows(Json.Document(Binary.Decompress(Binary.FromText("i45WMjQwVNJRCgYRjkBsZGxqBqRc89JzMoszlGJ1QCqMYCpcECp8E0tg0sYwaSeEdHByZmpecipUhQkWFahWmMJUOGO1AmykEcyNhqYmGFaYwlQ4IVSgWmGCRQWqGcZYbMEREm64vIpNBRavGsFUoLkjFgA=", BinaryEncoding.Base64), Compression.Deflate)), let _t = ((type nullable text) meta [Serialized.Text = true]) in type table [ID = _t, Period = _t, Grade = _t, #"Bldg#" = _t, Subject = _t]),
    #"Changed Type" = Table.TransformColumnTypes(Source,{{"ID", Int64.Type}, {"Period", type text}, {"Grade", type text}, {"Bldg#", Int64.Type}, {"Subject", type text}}),
    #"Sorted Rows" = Table.Sort(#"Changed Type",{{"ID", Order.Ascending}}),
    #"Added Conditional Column" = Table.AddColumn(#"Sorted Rows", "Fail", each if [Grade] = "A" then 0 else if [Grade] = "D" then 1 else if [Grade] = "F" then 1 else if [Grade] = "B" then 0 else if [Grade] = "C" then 0 else null, type number),
    #"Changed Type1" = Table.TransformColumnTypes(#"Added Conditional Column",{{"Fail", Int64.Type}}),
    #"Filtered Rows" = Table.SelectRows(#"Changed Type1", each ([Fail] = 1)),
    #"Removed Other Columns" = Table.SelectColumns(#"Filtered Rows",{"ID", "Subject"}),
    #"Grouped Rows" = Table.Group(#"Removed Other Columns", {"ID"}, {{"All", each _, type table [ID=nullable number, Subject=nullable text]}, {"Count", each Table.RowCount(_), Int64.Type}}),
    #"Added Custom" = Table.AddColumn(#"Grouped Rows", "Custom", each Table.SelectColumns( [All], "Subject" )),
    #"Added Custom1" = Table.AddColumn(#"Added Custom", "Custom.1", each Table.ToList([Custom] )),
    #"Extracted Values" = Table.TransformColumns(#"Added Custom1", {"Custom.1", each Text.Combine(List.Transform(_, Text.From), ", "), type text}),
    #"Renamed Columns" = Table.RenameColumns(#"Extracted Values",{{"Custom.1", "Failed Subjects"}}),
    #"Removed Other Columns1" = Table.SelectColumns(#"Renamed Columns",{"Count", "Failed Subjects"}),
    #"Reordered Columns" = Table.ReorderColumns(#"Removed Other Columns1",{"Failed Subjects", "Count"}),
    #"Renamed Columns1" = Table.RenameColumns(#"Reordered Columns",{{"Count", "Items"}}),
    #"Grouped Rows1" = Table.Group(#"Renamed Columns1", {"Failed Subjects"}, {{"All", each _, type table [Failed Subjects=text, Items=number]}, {"Count", each Table.RowCount(_), Int64.Type}}),
    #"Expanded All" = Table.ExpandTableColumn(#"Grouped Rows1", "All", {"Items"}, {"Items"}),
    #"Renamed Columns2" = Table.RenameColumns(#"Expanded All",{{"Count", "Incidence"}}),
    #"Changed Type2" = Table.TransformColumnTypes(#"Renamed Columns2",{{"Items", Int64.Type}})
in
    #"Changed Type2" 

I hope this hits the mark this time. Full revised solution file below.

– Brian
eDNA Forum - failing_courses solution.pbix (36.0 KB)

1 Like

Brian,

Thank you so much, this really helps, however, I am also trying to keep the filters option for users to select period of bldg. I have tried using group by before, however, those options seems to create disruptions. I have two slicers for users. This would hopefully be the last issue.
image

@supergallagher25,

No problem at all. I just modified the M code to keep it from removing those two columns in the grouping steps, and you’ve got your two slicers back.

image

Solution file with revised code posted below.

– Brian
eDNA Forum - failing_courses solution.pbix (38.0 KB)

Brian,

One last thing, I apologize for the inconvenience, I am still working on my skills in power query, I am unable to do a percentage of “F” here. I have tried to remove the filter step in the query editor and it returns doesn’t seem to work.

For example, Science should have 5 records with 2 Fs.
image

@supergallagher25,

This is the point where I think you need to go back and revisit your data modeling. At this point, you’ve now got two versions of your fact table to work with: the original, and the unpivoted version. I think the next step is for you to construct your dimension tables (e.g., Subject, Period, Building, etc.) and connect those appropriately to your fact tables, so that your slicer fields come from your dimension tables and not your fact tables.

When constructed this way, I think you can get all the information you need by choosing the appropriate version of your fact table and slicing it/filtering it/aggregating it as needed.

Give it a go, and give a shout if you run into any problems.

I’ve attached a cleaned up version of the solution file, since the idiotic “autodetect relationships” feature had linked the two fact tables in its typical nonsensical way…

– Brian

eDNA Forum - failing_courses solution.pbix (37.1 KB)

2 Likes

Hi @supergallagher25 , did the response provided by @BrianJ help you solve your query? If not, how far did you get and what kind of help you need further? If yes, kindly mark the thread as solved. Thanks!

Hi @supergallagher25, we’ve noticed that no response has been received from you since the 8th of January. We just want to check if you still need further help with this post? In case there won’t be any activity on it in the next few days, we’ll be tagging this post as Solved. If you have a follow question or concern related to this topic, please remove the Solution tag first by clicking the three dots beside Reply and then untick the checkbox. Thanks!

A response on this post has been tagged as “Solution”. If you have a follow question or concern related to this topic, please remove the Solution tag first by clicking the three dots beside Reply and then untick the check box. Thanks!