I have a couple of problems I was hoping that some of you might be able to help me with.
I have a large dataset that consists of projects, principle investigator, source of income and type of projects. I have no problems with basic calculations such as number of projects per principle investigator etc. However, im struggling more when it comes to calculating number of projects per source and or type of projects. The reason for this is that each project can be funded by numerous sources (10 different), and can be categorized by many types (8 different). Each source and type and separated by “;”.
Project
PI
Type
Source
A
Eric
Health; Work
State
B
Curt
Work
Own
C
Damon
Health
State; Own
D
Patrick
Health
Own
E
June
Work; Health
Own; State
I have created two disconnected tables, one for source and one for type, and are planning on using them as slicers.
What I want is:
Calculate number of projects that contains a specific type or source and display it in a card. E.g If I select “Health” the result should be 4. If I select Work, the result should be 3.
Calculate number of projects that contains both a specific type and source. If I select both Health (slicer 1) and State (slicer 2) the result would be 3.
I have attached an example of my data as an Excel-file and as a pbix-file. In my original source I have approx 500 projects, 10 different sources and 8 different types. I tried to make measures for calculating number of projects based on selectedvalue in a slicer using the following DAX;
No of projects pr source =
VAR _a=SELECTEDVALUE('Dis Table Source'[Source])

RETURN
CALCULATE(
    [No of projects],
    FILTER('Fact',
    FIND(_a,'Fact'[Source], ,0)>0))
However this does not work. Perhaps the “Find”-function is the problem, and it should be swapped for “containsstring”?
Further to be able to calculate based on both slicers (source and type) I was thinking of combining the two measures, but can wrap my head around how to do this.
Thanks alot, that worked (almost). I sadly forgot to mention that some projects are registered more than once. Is there a way to incororporate a distinct count into your measures ?
I tried swapping out countrows for “distinctcount”, “distinct” and “values”, but cant get any of them to work.
can you upload the xlsx file with some more data and what the result would be?
A measure taking into account project, source and type?
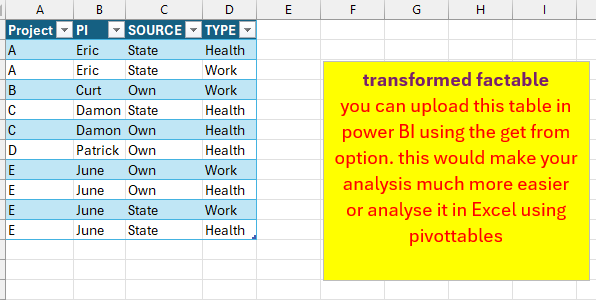
Take a look at the attached excel file where I used the get and transform option from excel ( or Power BI)
with the result a proper workable list that you can upload in power BI
If you data is structured in the same way as you sample xlsx file
the transformation ( your factable ) to a more workable list as shown in the above screen shot is dynamic
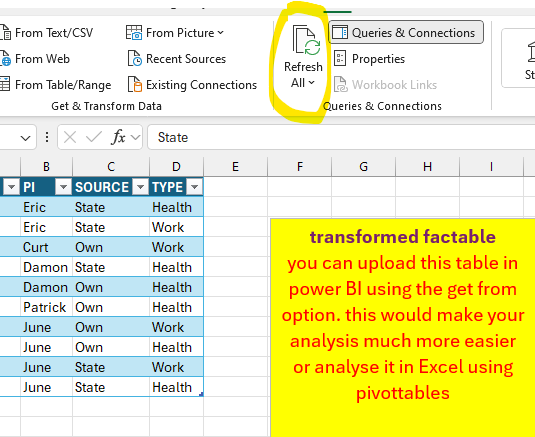
so if you add more data to you factable the other list is updated when you refresh the data
see screenshot below.
I’m still waiting for an updated factable & wanted output to adjust the measures
Sorry for not getting back to you earlier, Ive been out of town.
I have never noticed in the Power Query that you can split by delimiter into rows (only columns). As you wrote in your latest reply this made it so much easier, and simple measures did the trick.
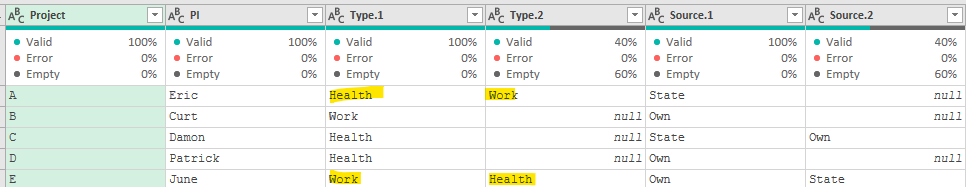
the spliting of the columns is not the issue, check if the "the unpivot the column " is working correctly
in your dataset, the order is not always the same, see "Health , Work " & " Work , Health ".
If there are more than 2 items in the column then adjust the # of splittings the columns and the unpivot
columns.
Thanks again.
I see what you mean. You split the column into “new” columns by delimeter and then used the “unpivot columns” after. I thought you had split the columns into rows (which is also and option under “split columns”). This way I didnt have to unpivot the columns after.