Hey,
I’m clearly missing something very simple here, but a few hours of searching hasn’t got me any closer.
I’m trying to figure out how I can count the number of days in a time period where an integer measure exceeds a threshold.
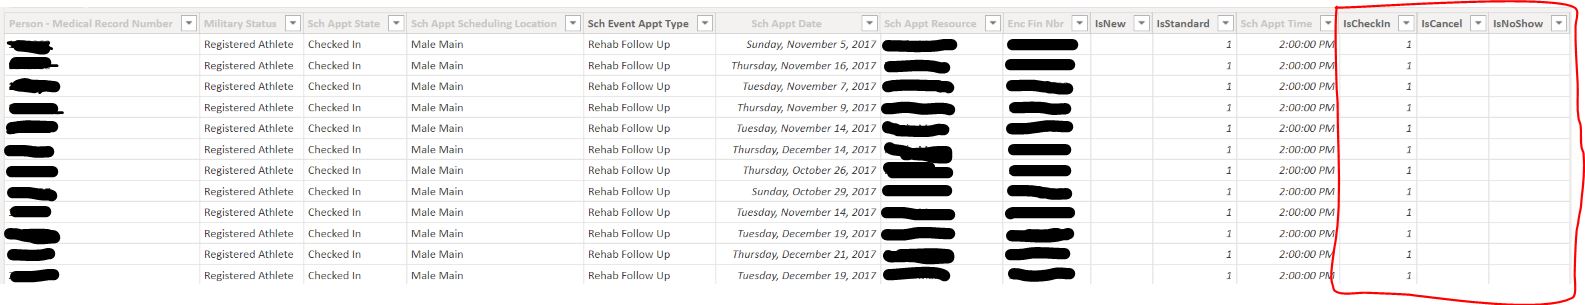
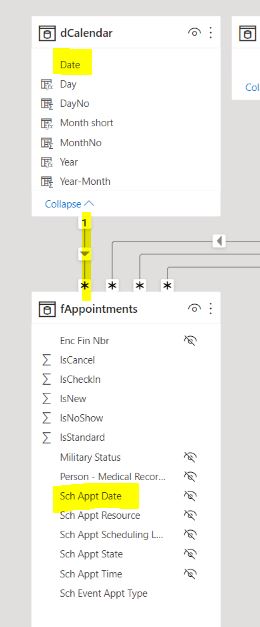
The measure is simply the sum of the appointments in the main fact table, these have 3 states: IsCheckIn, IsCanceled, IsNoShow - these are coded as 1 or null:
so a simple sum of the column gives me the total:
and the sum of all 3 states is the Total Appointments of any type:
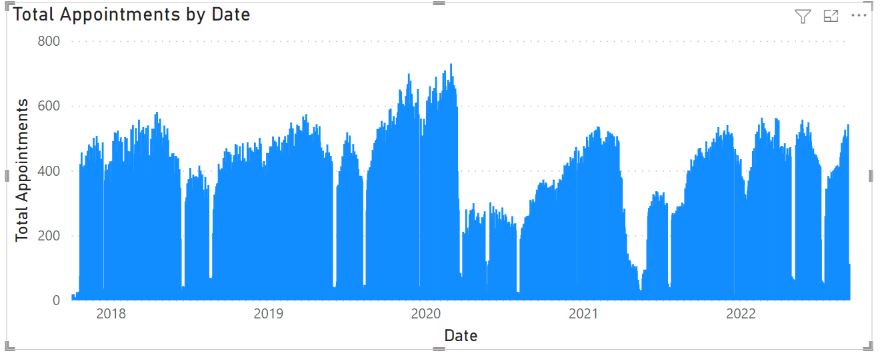
Visualising this by date (day) verifies it’s what I want:
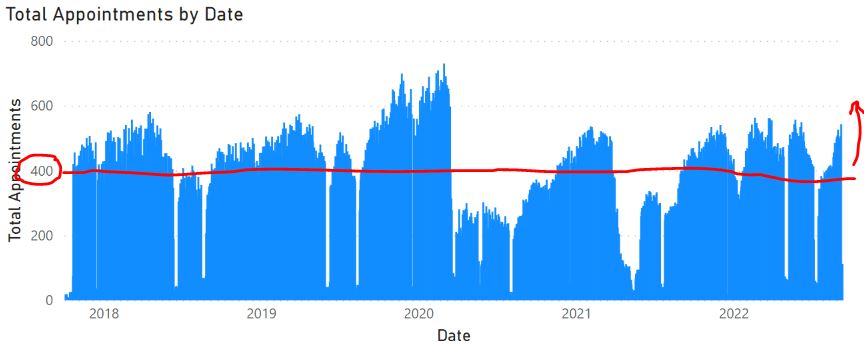
So my question is, how do I count the number of days above a certain threshold?
For example, if I chose the threshold to be 400, how do I count the number of days we had more than this in the displayed time period?
I don’t know why I was so confused here, so apologies in advance, and just I’m posting this solution in case someone else ever needs this, and to close off this thread.
What worked for me was to create a SUMX iterating across all dates and counting those that exceeded the threshold.
For simplicity’s sake I hard coded this threshold as 386*: Days Above 100% = sumx(values(dCalendar[Date]),if([Total appointments]>386,1,0))
which made calculating the percentages easy: Pct Days Above 100% = divide([Days Above 100%],([Days Above 100%]+[Days Below 100%]))
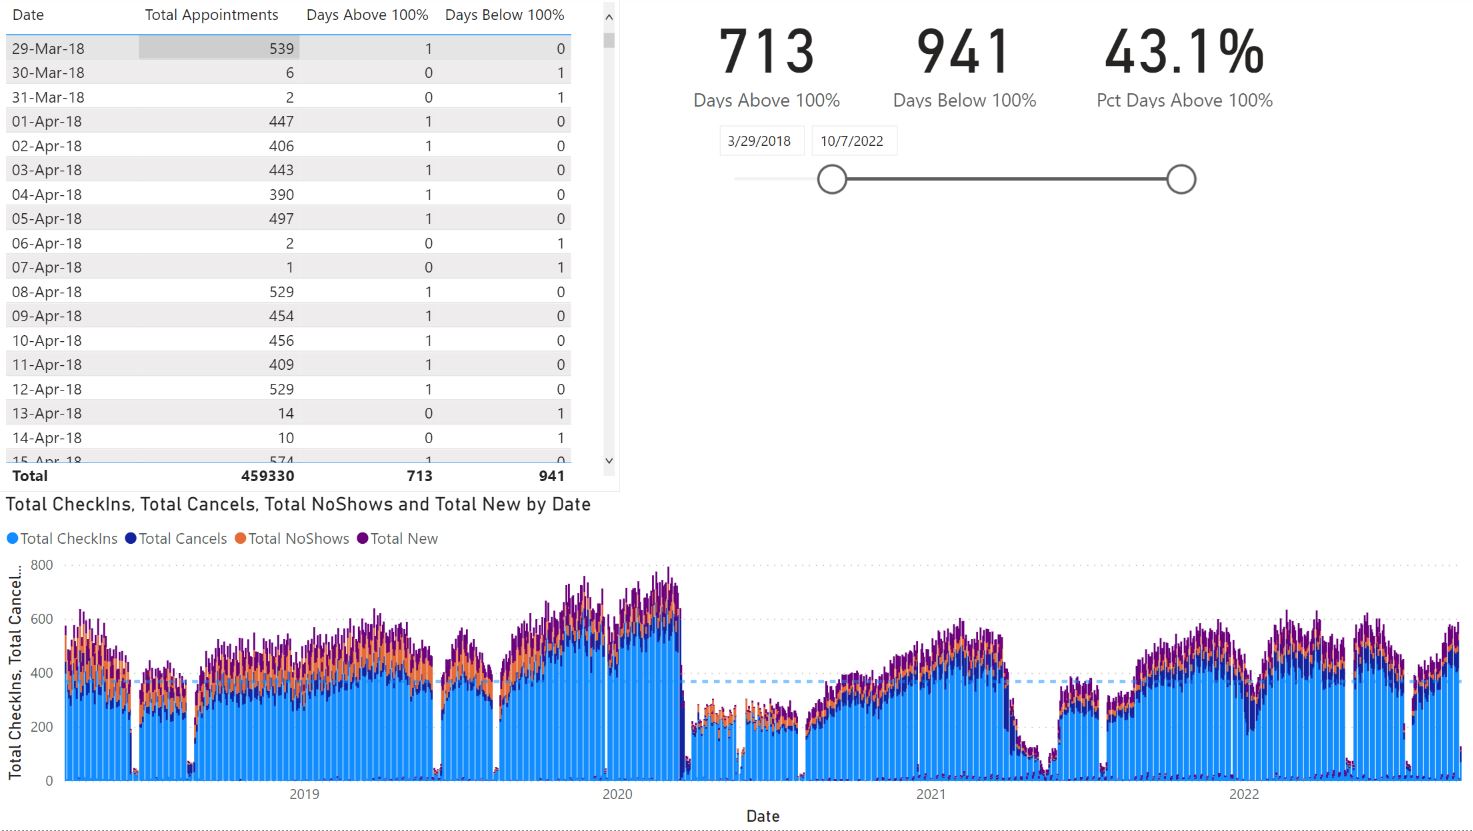
Verifying the results with a table and a visual:
Sorry if anyone wasted time reading this before my reply.
*The real solution dynamically calculates the threshold based on daily capacity, but that got a bit complex to show here, and wasn’t related to the original question