I am building a supply chain dash board at our company and a big problem we are having is STOCK OUTS.
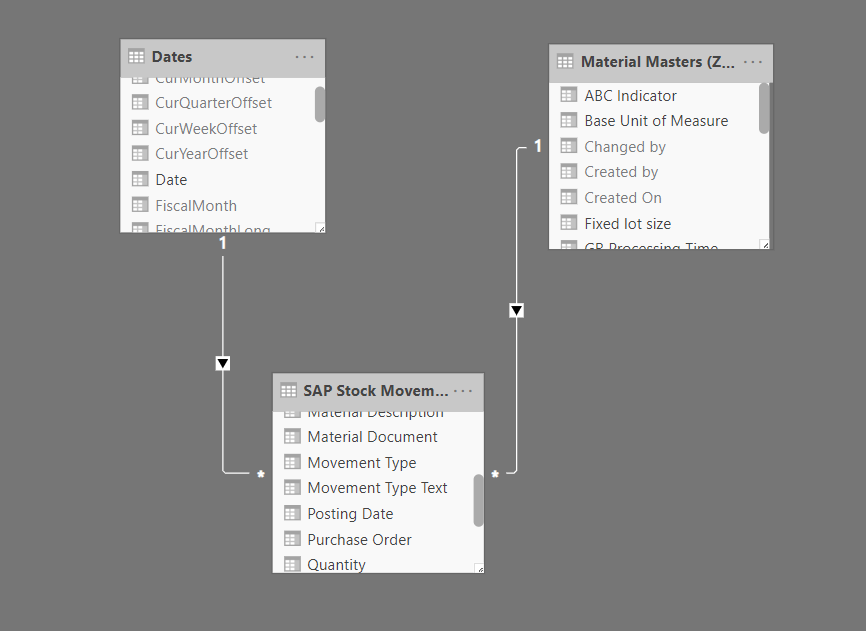
I have a table of over 5 million rows that contains all our SAP movement data inside inbound goods in and outbound issues to production.
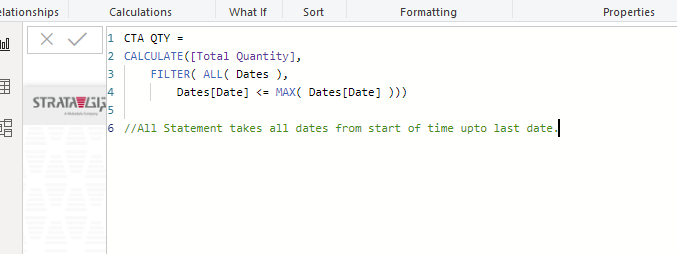
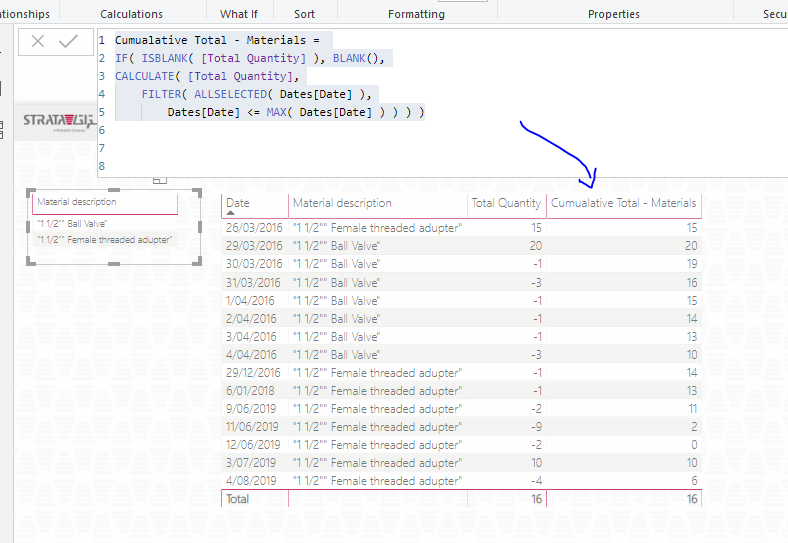
From here i have created the cumulative / Running totals measures very easily from the Enterprise DNA superb videos using (CTA = Cumulative Total All (All meaning all filter))
//All Statement takes all dates from start of time upto last date.
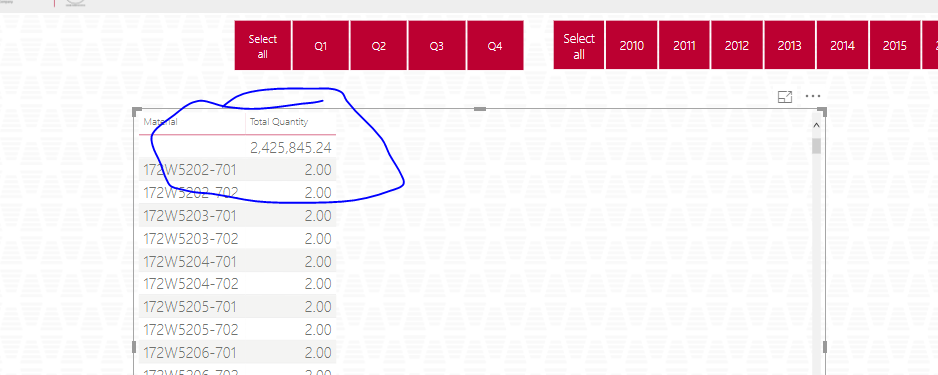
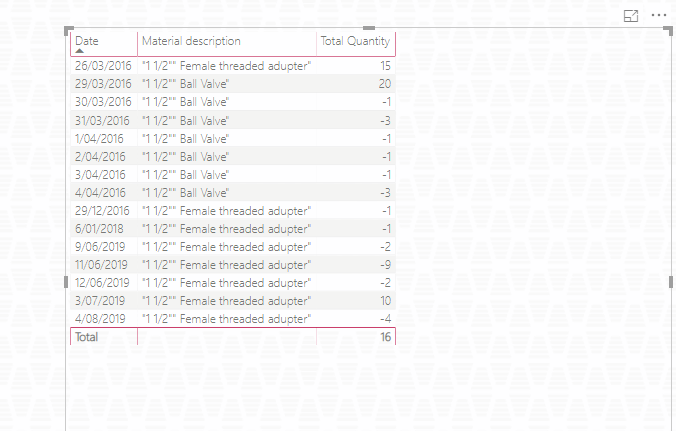
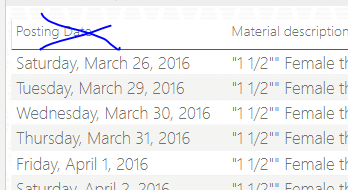
Now I see some information such as (See screen shot of my table)
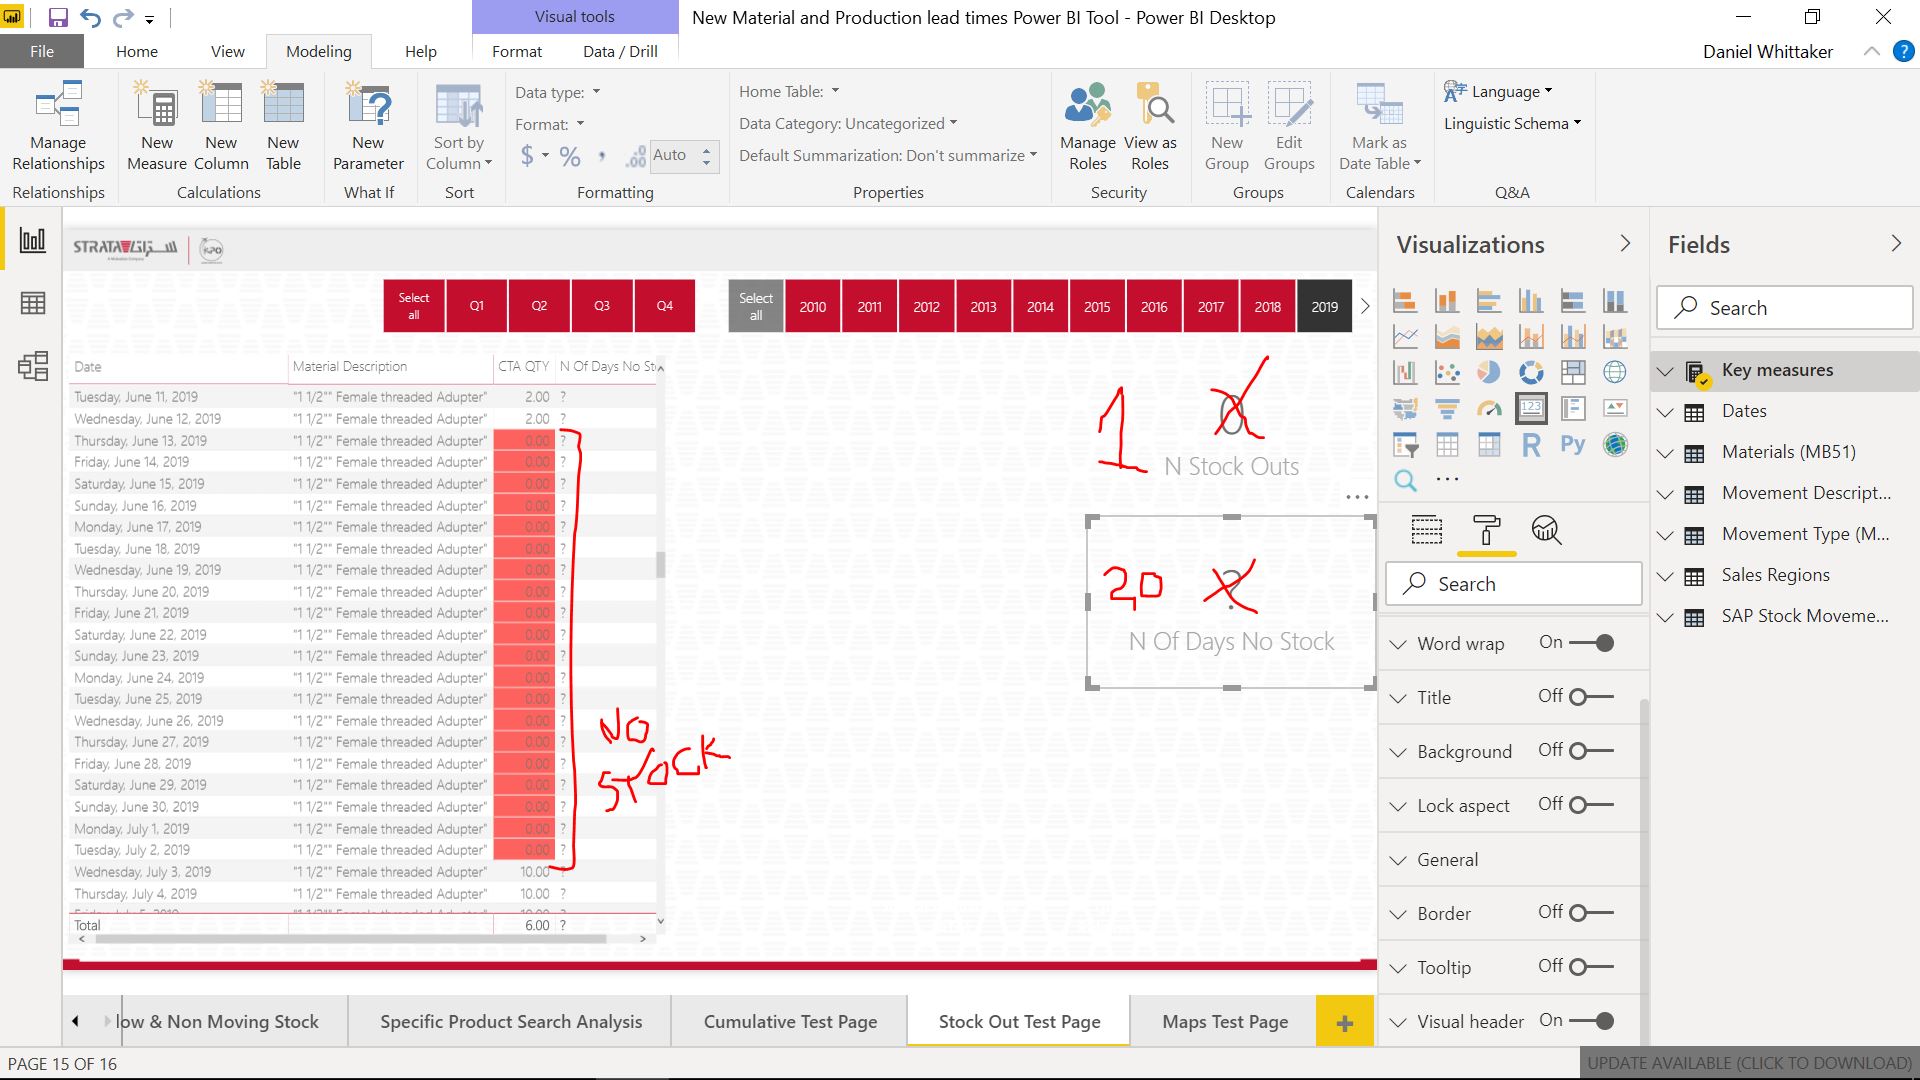
Date that stock hit zero
length of time stock was at zero before goods in stock was received.
My problem is I cannot figure out how to…
Count the unique amount of times that product hit Zero stock? i have created a IF statement, N Stock Outs = IF( [CTA QTY] <= 0, “1”, “0”) as this creates a 0 and 1 for me but i dont know really where i go from here ? to get it to uniquely identify an exact count of a stock out date.
Create the N of days with zero stock. Potentially the formula above gives me a consecutive run of 1s i could some how count all those up and get a total but i dont know how to do it.
Is it possible one of you clever people can show me how to do it?
Ok the key here is understand iterating functions and how they work logic through a table (or virtual table) at every single row.
Instead of using if statements you should be using either…
COUNTX

or

CALCULATE( COUNTROWS( .... ),
     FILTER( ALL( .......),
            Some logic here for every row )
The context of you calculation is very important here also.
If you are looking for answers in the card visualization this means that basically there is no context other than what is coming from the slicers in your report. But if you are able to select specific products in a slicer this bring a new element to the calculations.
So for example you probably want something like this.
Something like the above I think will get you there.
Other than this would need to see an example file to assist any further as there could be other things to consider, but this is my best guess based on the information provided so far.
Thanks for your reply and firstly congrats on your site ! its been very useful to me and don’t mind paying a fee for your professional help and excellent videos, well done.
Onto the business!
OK so i don’t just want the number in a card i need to be able to show it in the table in the screen shot alongside each material name. As i have it in the file
How about the number of total days the product has been out of stock? i also need that in the table too. again as is in the file i just added a question mark where i need the result as i dont know the formula.
I tried your formula however it didn’t seem to work is it for a measure or new calculated table? the table is my file runs through dates look up / filter table as shown in file uploaded.
From here look to simplify things. (this is what I do all the time)
I’m just looking to get to the core problem here that needs to be solved.
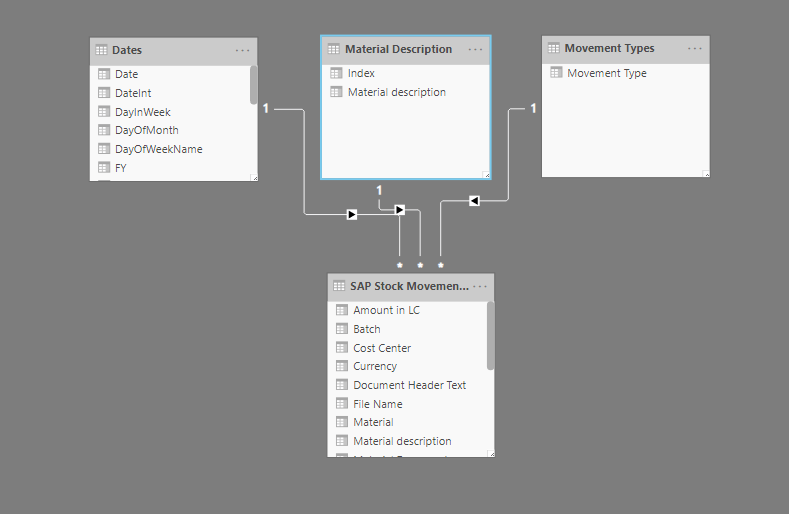
To me there’s also some things wrong with your data here. The materials table doesn’t match up to the fact table of SAP stock movement. A quick bit of auditing got me here.
This calculates a cumulative total, but I’m very confused as to how this is relevant in this example?
How does this work into your calculation for your stock levels.
Overall, there’s quite a bit not working well here.
I think you’ll really have to understand a bit more about how you can setup up this well in your model and how you ultimately want to visualize things a bit more before moving on.
Its a Sample file, and a lot of data had to be removed in order to send it to you and condense it to a reasonable size and protect privacy. I have made a sample for you and cleaned it up.
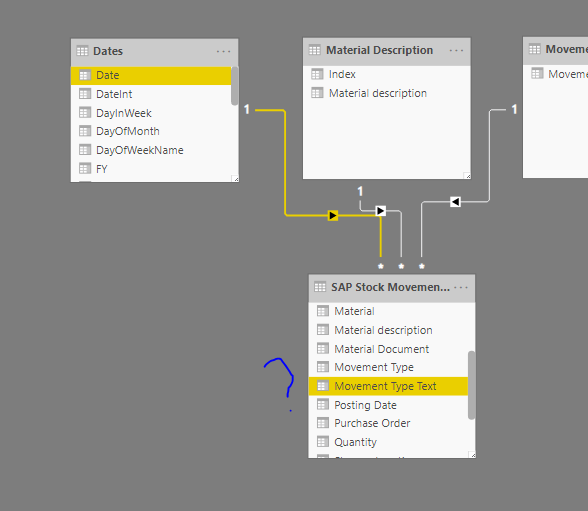
I see here your date table isn’t even connected to anything. It’s no use unless there is a relationship. = Maybe i missed reconnecting it after i was playing with other problem i had with circular data.
Highly recommend going through this course here when you next have a chance = Watched it and i understand think i just missed reconnecting it not a biggie.
I’m just looking to get to the core problem here that needs to be solved. = Me too but need your help to solve it.
The materials table doesn’t match up to the fact table of SAP stock movement. A quick bit of auditing got me here. = I see there are some issues with my main SAP data yes ill try and clean it up.
This calculates a cumulative total, but I’m very confused as to how this is relevant in this example? How does this work into your calculation for your stock levels. = Total quantity is the total QTY of the stock movements added together. i was thinking i can use it to highlight the out of stock times?
I think you’ll really have to understand a bit more about how you can setup up this well in your model and how you ultimately want to visualize things a bit more before moving on. = I feel i do understand it maybe just a mix up with the sample table i sent you.
As for visualization i would like a table that displays columns with
. Date
. Material name
. Total stock = As of now for each item
. UOM = Unit of measure
. N stock Outs = Total number of occurrences / unique times material has hit zero stock
. N days no stock = Total days material has had no stock (In days)
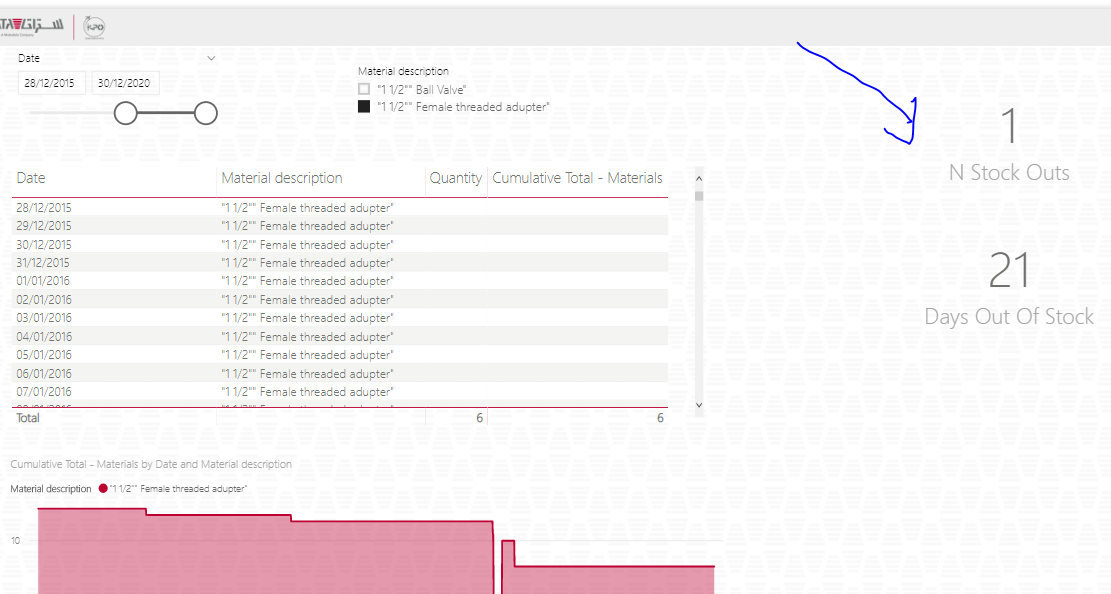
Two cards as shown in sample with total stock outs and total days with missing materials. (All items)
From here I guess you maybe do need a cumulative total BUT you need it for each Material. This actually works as you originally did it. There’s is though some optimization that can be done.
Post this…I’m still working on the ultimate solution on this. There might be a bit more to it than originally thought. Will be back once I have something more.
Thanks looks great for totals days no stock appreciate your work on this and im learning all the time. However i still have a couple of issues.
How do i get the total number of occurrences the product has stocked out? In this materials example its hit zero once, so the card value should show 1, in other materials its hit many times but it has to be unique occurrences its touched zero stock. Measure name = N of stock outs
Is it possible to amend the formula that if it doesn’t ever stock out rather than say (Blank) in the card Total days no stock or any other card it should say 0 ?
In your dates table is there a way to have the max date to always equal the date it is today so my graphs do not go all way to 2020 like this one giving a false reading? this is because my dates table is set to 31/12/2020, or can you adjust the measure to only go to todays date? i thought thats what the MAX function does or is that MAX of the dates table?
I have set up the new sample PBIX for how i want my visualization to look.
I Have come across an issue with the number of stock outs on my main dash board i want to display a visual that shows the top 5 stock out items this is easy enough using the visual filters.
However the model has to perform this on 6 million lines of data from MB51 and takes forever and i just get the spinning wheel like its calculating. is there any way to change the formula for the visual so it calculates faster via Top N in Dax?
Your way above works perfectly for single items ( I use this fine on the product drill down page) but not when searching multiple products anything over and putting it in a Top N graph on the main dashboard.
Unfortunately i cant share the model as its 150 mb but i can show you screen shots.
BTW your formula above does work when i filter the data via slicers to only search low numbers of products.
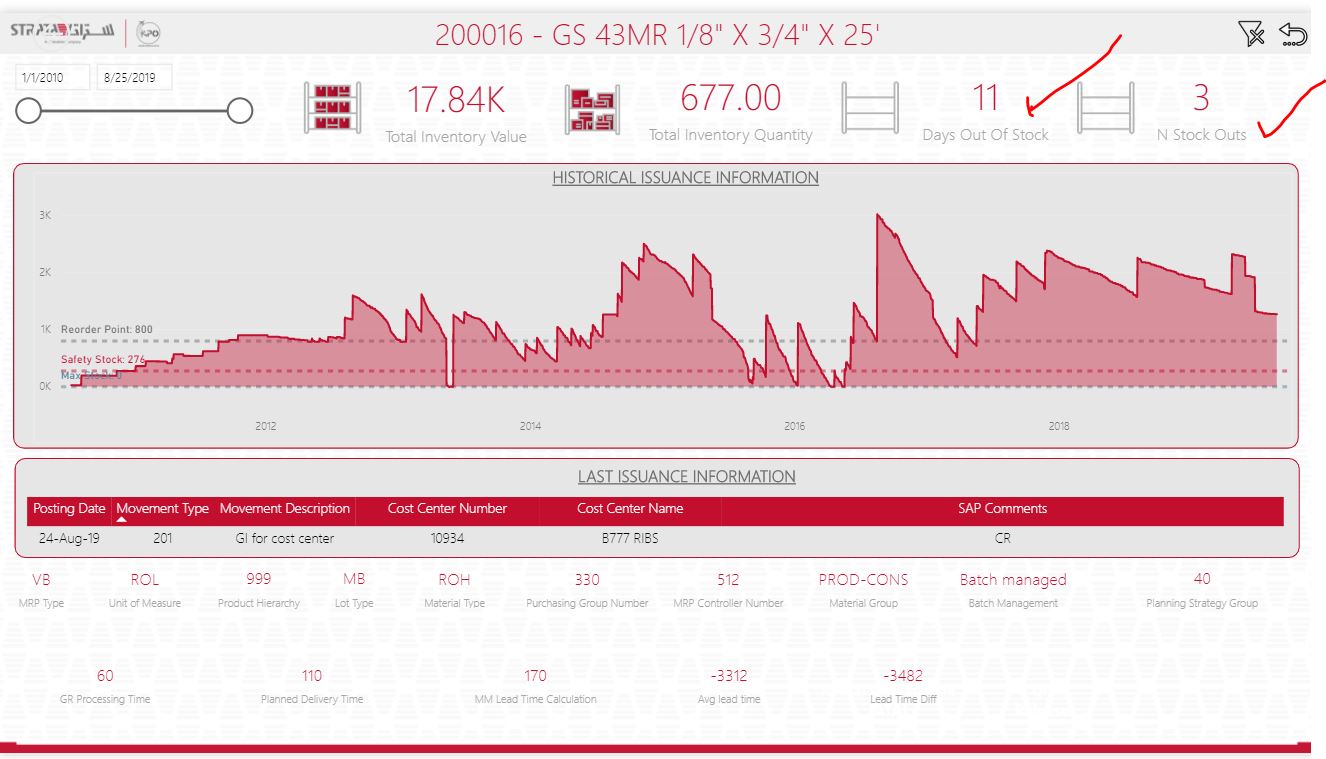
1st screen shot (Capture) shows the individual drill down page per material your DAX for N Stock out and days out of stock work perfectly
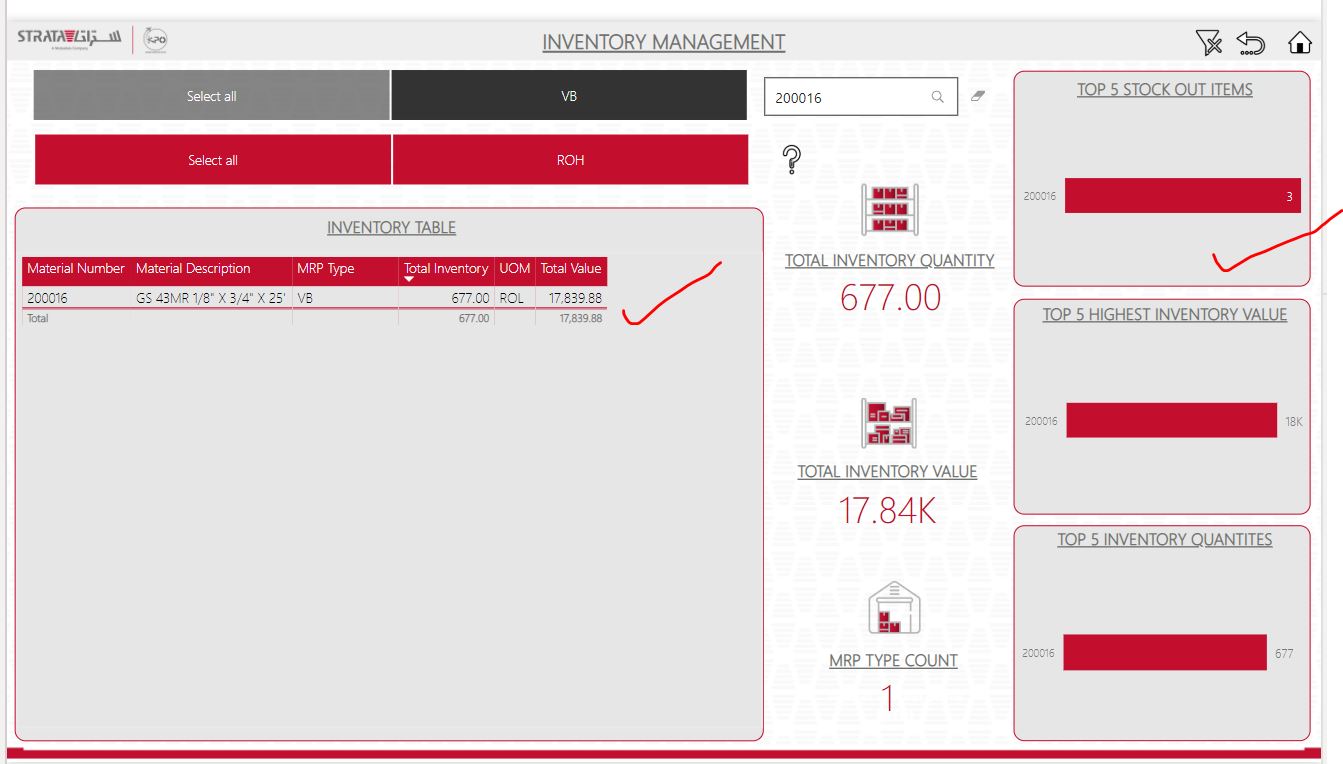
2nd Screen shot is the main inventory dash board and in top right. I want it when all filters are off to show the top 5 number of stock out items. this screen shot shows it works when you filter a low number of results as shown here. It works upto around 2000 products then struggles.
3rd Screen shot is when all filters are removed there are 29000 products (God bless Aerospace) in our stores and the calculation just spins and spins and cant return a result for that volume of lines i presume! 6 million lines in the MB51 data set