Hi Team,
This is my very first topic in this forum, so please bare with me on this. I have built a dashboard for my project’s HR team but they want one function which I can’t seem to do. I have a project resources table that contains Resource Names, Start Date and Finish Date. I need to create a table or a graph that shows the total number of resources by financial year based on the start and finish dates excluding the vacant positions. Here is an example:
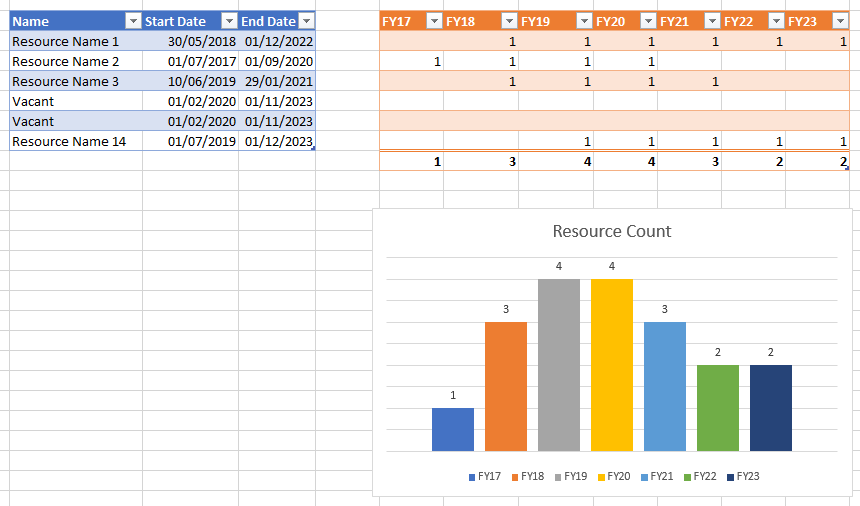
In the above image:
- Blue table (“Resource Plan”) - contains the resources details (sample data only)
- Orange table - this is the data I want to create through a measure or something
- Graph - Final result
Basically, a resource can be employed over number of years and I need to represent that using start and finish dates. Also note oor financial year goes from July to June (ie 1/7/19 to 30/6/20)
I tried to come up with a solution by creating the following measure but it only gives the total where the financial year relates to the start date. It doesn’t provide a count for every financial year though to end date.
Employee Count =
VAR MaxDate = MAX ( ‘Calendar’[Date] )
VAR EmpCnt =
CALCULATE (
COUNTROWS (
CALCULATETABLE ( ‘Resource Plan’, ‘Resource Plan’[Start Date] <= MaxDate, ALL ( ‘Calendar’[Date] ) )),
(ISBLANK ( ‘Resource Plan’[End Date]) || ‘Resource Plan’[End Date] > MaxDate))
RETURN
IF ( ISBLANK ( EmpCnt ), 0, EmpCnt )
Thank you in advance for your help. Much appreciated 


 Glad to help.