My raw data has Name, location name, Date of login. I have a virtual table which gives me location name, Frequency Group and Login Counts. Here Frequency Group and Login Count are Measures. What I really want to do is -
Count How many logins per Location (Should be able to filter by year/month)
Then Compare it with Frequency Group to see which bucket that count falls into
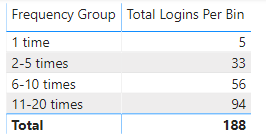
Then Again count- How many Locations fall into each bucket. Meaning there are “50” locations with “1 time” logins, "20 " locations with “2-5 times logins” etc…
I did First 2 steps. I’m not able to do 3rd. Can someone help me. Here is the sample data after step 2. Virtual data.xlsx (8.7 KB)
Wow! Yes, That table you have, that is exactly what I’m trying to do. But stuck with no idea to write DAX. I have ideas in other world to do this! Anyway. Thanks for the DAX. I will try this and let you know. It might be something to do with Data model too… Let me try this first.
Thanks for posting your question @pshetty. To receive a resolution in a timely manner please make sure that you provide all the necessary details on this thread.
Here is a potential list of additional information to include in this thread; demo pbix file, images of the entire scenario you are dealing with, screenshot of the data model, details of how you want to visualize a result, and any other supporting links and details.
Including all of the above will likely enable a quick solution to your question.
Thanks for the PBIX file - definitely makes it easier to provide a better, clearer solution.
This is a textbook dynamic segmentation problem. There are number of different ways to handle this, but I followed the approach that @sam.mckay uses in his videos on this topic.
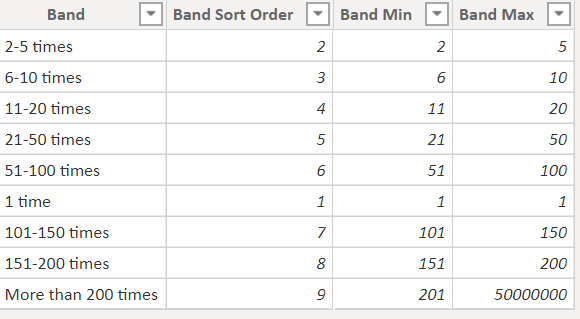
Step 1: create a disconnected supporting table defining the parameters of your frequency bands:
Step 2: create a measure to count the number of locations in each frequency band:
This is very cool. I knew I was not doing it right. I was watching his videos, I think I haven’t got segmentation section yet… Thank you very much for taking time to explain this. I will try myself now.
It’s a really flexible and powerful technique. Here’s one more short (11 min.) video where @sam.mckay breaks down really clearly exactly what the DAX measure is doing.
 Anyway. Thanks for the DAX. I will try this and let you know. It might be something to do with Data model too… Let me try this first.