Count of distinct two columns with filter

Hi all,
I am trying to calculation the unique number of users who did 2 or more activities from two separate columns in one table.
My data looks like this:

Table

Coumn1 :
user_id

1
2
3
4
5

Coumn2 :
Activity_id
aa1
aa2
aa3
aa4
aa5

First I want to get the distinct count of users and then filter those users that have done 2 or more activities.
I am trying something like this, but I am not getting the values right.

   VAR allData = 

ADDCOLUMNS(
VALUES(Table[activity_id]),
“rowCount”,
CALCULATE( COUNTROWS( Table) )
)
return
CALCULATE(
COUNTROWS( allData ),
filter (allData, [rowCount] >=7)
)

I appreciate all the help.sample.pbix (22.7 KB)
@iasma,

First off, thanks very much for providing both a PBIX file and a detailed description of your problem – makes it much easier to provide quick and specific support. The first problem I see is that your data are incompatible with the analysis you want to do. You have 39 rows and 39 unique users, so by definition each user will only have done one activity. I would expect the dataset to have multiple entries for each/many users.

Another question is does our count include all activities or just distinct activities (e.g. if someone does one activity three times does that count as three or one?)

Finally, your write up implies the threshold is two or more, but your DAX implies it is seven or more, which is the correct number?

If you can please resolve these questions and provide a revised data set, I should be able to get you a solution quite quickly.

Thanks.

– Brian

Thank you so much for the quick reply.
I provided more compatible data now.

to answer your question, there is only one type of activity. so if someone does one activity three times we count it as three.
We want to know the distinct count of users who has done two or more activities.

I also tried another measure, not sure tho I am getting the right values.

Thanks a lot for your help. sample.pbix (4.2 MB)

Hello @iasma,

Thank You for posting your query onto the Forum.

Is this the type of result that you’re looking for? Below is the screenshot provided for the reference -

To achieve this type of result below is the formula provided for the reference -

Count Of Activity = 
COUNTX( 'Table' , 'Table'[User ID] )

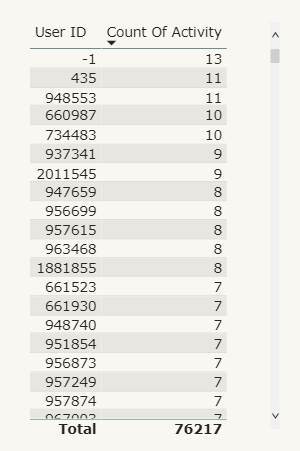
After writing the above formula, this is the results you’ll actually get -

image

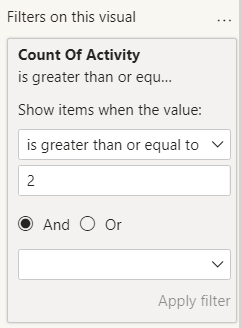
Now, go to the FILTER PANE and under the “Count Of Activity” field select the “is greater than or equal to” option and put 2 as a condition.

FILTER PANE

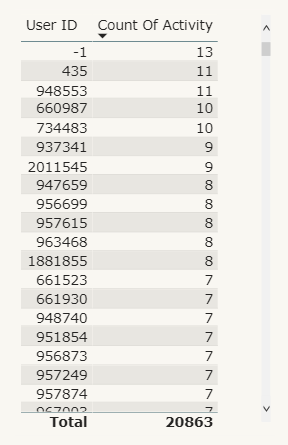
Once you apply the filters now you’ll get the results of “User ID > 2”.

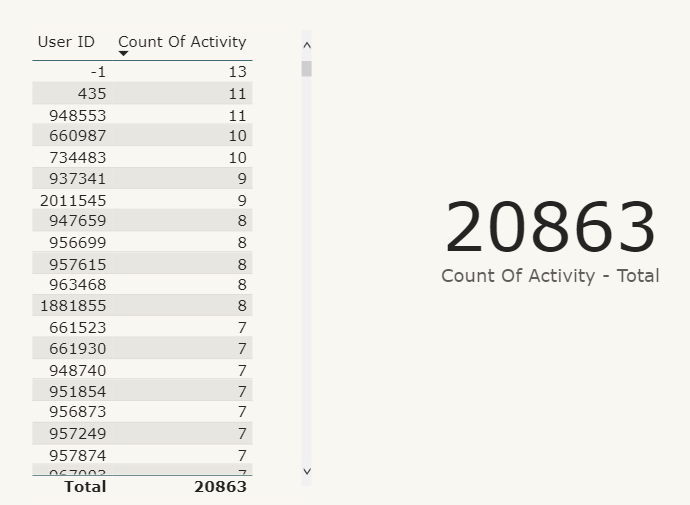
Result In A Table Visual

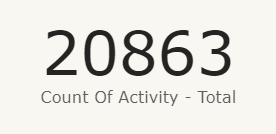
But the same method/technique cannot be used, if you want to show the results in a Card Visual since it’s doesn’t have any context. And therefore, we need to write just one more formula to show the results in a Card Visual.

Count Of Activity - Total = 
SUMX(
    FILTER(
        SUMMARIZE(
            'Table' , 
            'Table'[User ID] ,
            "@Totals" , 
            [Count Of Activity] 
            ) , 
    [@Totals] > 1 ) , 
[Count Of Activity] )

Result In A Card Visual

I’m also providing a link where of our expert @BrianJ has also created a video based on this topic. As well as also attaching the working of the PBIX file for the reference.

Hoping you find this useful and meets your requirements that you’ve been looking for. :slightly_smiling_face:

Thanks and Warm Regards,
Harsh

sample - Harsh.pbix (4.2 MB)

Thanks a lot, @Harsh for the detailed answer.
I am not sure about the answer, first I am looking to get the unique count of users, not the sum of activities.

count of activities

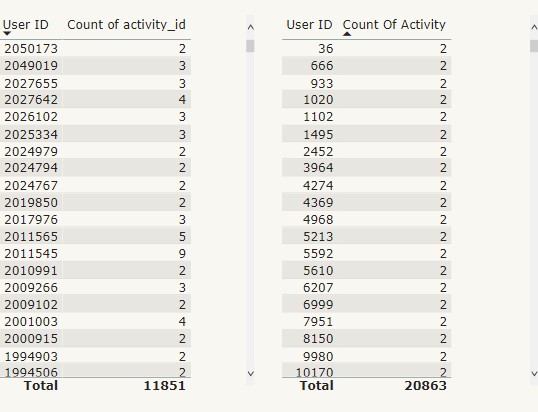
When I do the distinct count of activity and filtering =2 the values are not the same.
the left one from the table and the right one from the measure.

Let me know your thoughts

Hello @iasma,

Well, I’m not sure what method/technique you’re applying in your file to achieve the results that you’ve showcased in the left-side of the above screenshot. But the file which I’ve provided, I’ve done the calculations as per the requirement specified in the post where the users which are distinct ones i.e. where count of users = 1 they’re filtered out since they’re distinct users where activity has been performed only once and users who have performed more than one activity they’re showcased in the form of count in table and card visual.

Thanks and Warm Regards,
Harsh

Hi @iasma, did the response provided by @BrianJ and @Harsh help you solve your query? If not, how far did you get and what kind of help you need further? If yes, kindly mark as solution the answer that solved your query. Thanks!

The answer makes sense in the sample dataset but when I apply it to the actual dataset it doesn’t make sense.
The value is much larger than what expected.
I am trying to use Countx instead of Sumx in the formula but still not accurate.

Thank you Hash!
What if we tried to change the logic to calculate the total number of activities for users with 2 or more activities instead. If a user performs the activity 3 times we count it as 3.

would it possible to help me with that?

Thanks and warm regards,

Hello @iasma,

As suggested earlier, please check the PBIX file. When you mentioned 2 or more it by defaults includes 3 or more as well. And if you want 3 or more just change the context in the FILTER PANE where I had mentioned 2 in it, you just need to mention 3 in it to change the results and to evaulate the results in a card visual (if you want to) just change the line of formula. Below is the screenshot provided for the reference -

Thanks and Warm Regards,
Harsh

1 Like

Thanks a lot, @Harsh.