Hello @sanappi09,
Thank You for posting your query onto the Forum.
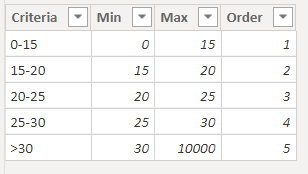
Firstly, you’ll be required to create a disconnected table with a minimum and maximum intervals suggested in it. Below is the screenshot provided for the reference -
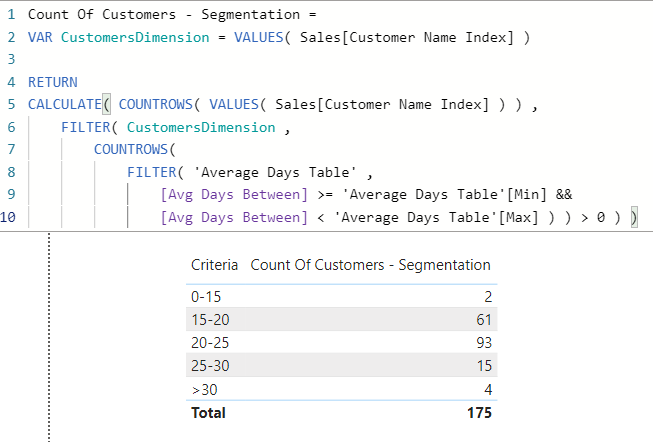
And then write the formula as provided below -
Count Of Customers - Segmentation =
VAR CustomersDimension = VALUES( Sales[Customer Name Index] )

RETURN
CALCULATE( COUNTROWS( VALUES( Sales[Customer Name Index] ) ) ,
    FILTER( CustomersDimension ,
        COUNTROWS(
            FILTER( 'Average Days Table' ,
                [Avg Days Between] >= 'Average Days Table'[Min] &&
                [Avg Days Between] < 'Average Days Table'[Max] ) ) > 0 ) )
So now, you can have the results in terms of bins. Below is the screenshot provided for the reference -
I’m also attaching the working of the PBIX file for the reference and also providing some of the links of the videos available onto the “Grouping and Segmentation” topic.
Hoping you find this useful and meets your requirements that you’ve been looking for. ![]()
Thanks and Warm Regards,
Harsh
EDNA - Average Days Between Solution - Harsh.pbix (449.8 KB)
https://medium.com/@sam.mckay/dynamically-group-and-segment-data-using-dax-in-power-bi-ba7e08e507ec


