I am working on customer analytics - trying to address few business questions around customer buying frequency, new and existing customers sales etc…
I’m using Avg Days between orders as one of the metric, this metrics provide insights into customers buying frequency…
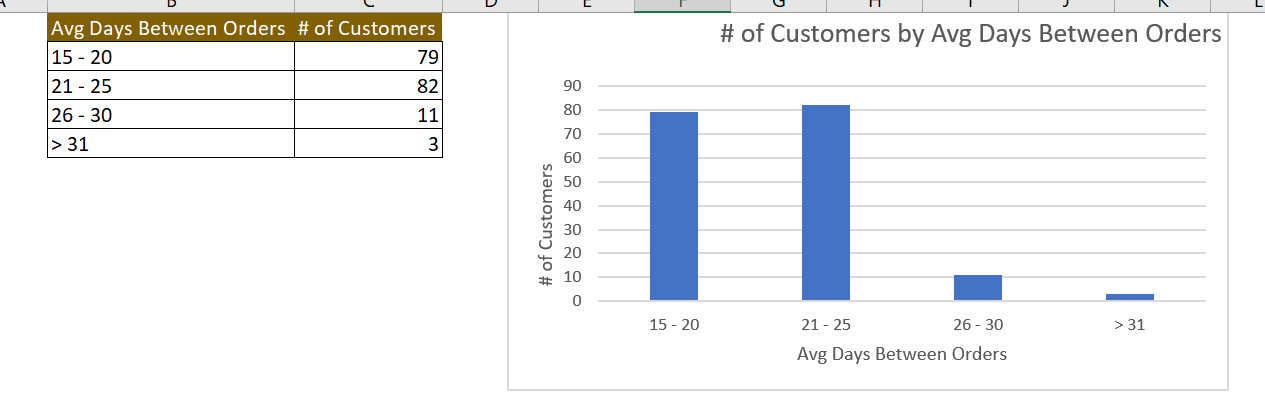
I am trying to show how customers are spread with respect to the buying frequency - simply want to provide details of no. of customer who have an avg days between orders - say 10 - 20 days, 21 - 25 days, 30 - 35 days etc…
In trying to search this portal, found one of the solution which is exactly how i have my data model set up as well…
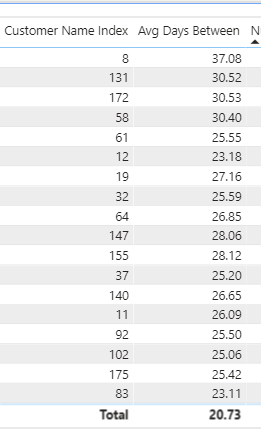
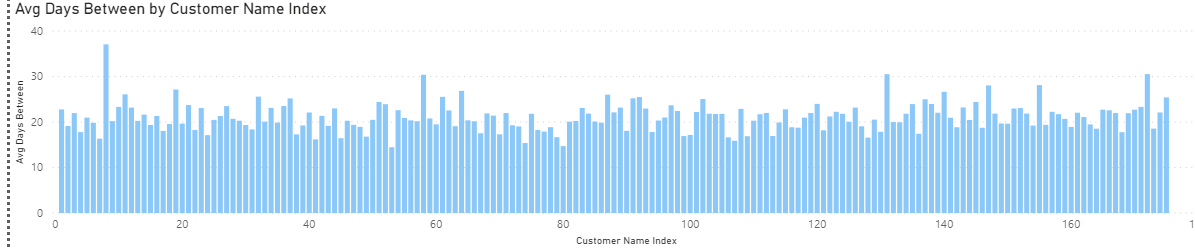
Here’s what my current data looks like as well… I have customer and an avg days between orders (measure) for each customers, like shown in the image below.
So reaching out here to see if anyone has been able to take a measure (which is calculated using summarize function) and apply binning… I have attached a sample datamodel here, which is how my data model is set up as well…
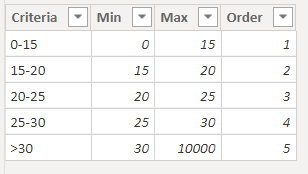
Firstly, you’ll be required to create a disconnected table with a minimum and maximum intervals suggested in it. Below is the screenshot provided for the reference -
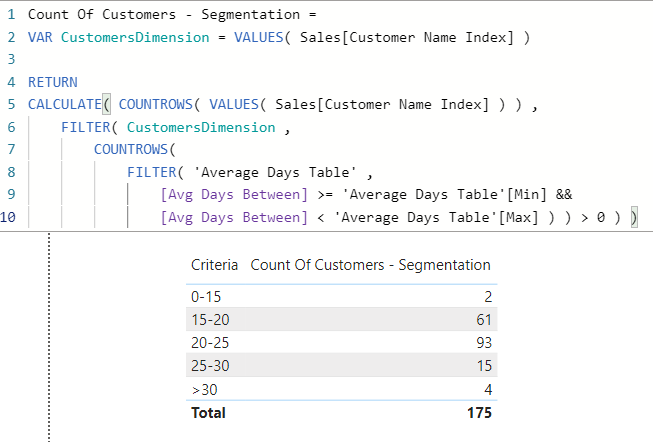
And then write the formula as provided below -
Count Of Customers - Segmentation =
VAR CustomersDimension = VALUES( Sales[Customer Name Index] )

RETURN
CALCULATE( COUNTROWS( VALUES( Sales[Customer Name Index] ) ) ,
    FILTER( CustomersDimension ,
        COUNTROWS(
            FILTER( 'Average Days Table' ,
                [Avg Days Between] >= 'Average Days Table'[Min] &&
                [Avg Days Between] < 'Average Days Table'[Max] ) ) > 0 ) )
So now, you can have the results in terms of bins. Below is the screenshot provided for the reference -
I’m also attaching the working of the PBIX file for the reference and also providing some of the links of the videos available onto the “Grouping and Segmentation” topic.
Hoping you find this useful and meets your requirements that you’ve been looking for.