I have been trying to achieve this visual but I am stuck with filtering correct rows based on date chosen from slicer. Events_230724.pbix (89.3 KB) Calendar TFL.csv (16.6 KB) Events .xlsx (18.2 KB)
If I choose 16/06/2024 , I should get all potential rows where this date falls between STARTDATE and ENDDATE from EVENT table and I can not retrieve rows where ENDDATE is above 16/06/2024. I was trying use ALLSELECTED filter to release all available dates from slicer but it didn’t work out. I need to add that I have to keep date slicer with the yesterday’s date as max date.
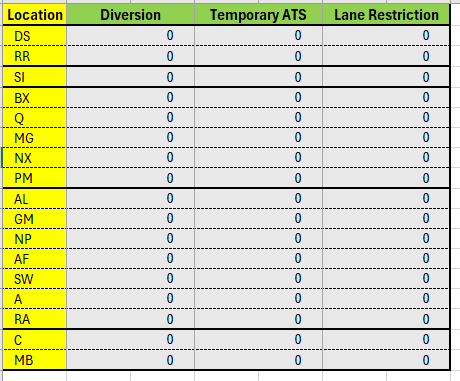
What I need to achieve to distinct count of each location based on three different categories (Diversion, Lane Restriction, Temporary ATS) for this data sample.
For any help in achieving my goal , I am very grateful.
attached the pbix file version 2
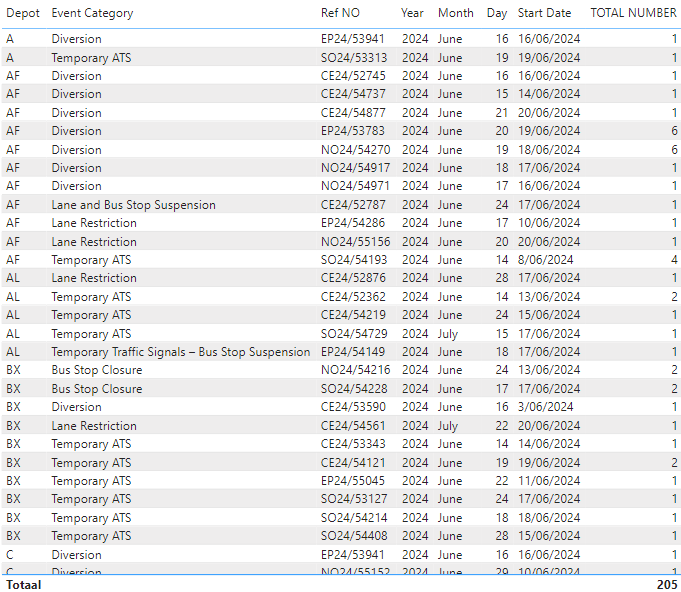
I added a proper calendartable ( startdate = first date of your events table [start date] en Enddate = last date of your events table [Enddate]
in the calendar table Iadded a column ¨[Active Date] thi pulls out the date from the calendar table if it is between the first date of the startdate ( events table ) and yesterday
a simple mesasure counts the total
the result is shown in the table. I’m not sure if this is what you are looking for
kind regards