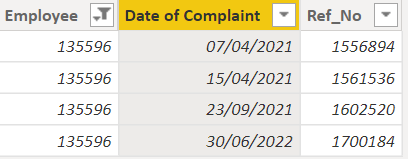
I am still hoping for a solution which gives me correct figures .
Iwona
Could you reply to my previous question / post ?
Hello @Iwona,
here is the measure that should provide the correct result:
Solution =
VAR _step1 =
    VALUES ( Sheet1[Employee] ) //table containing all unique employees
VAR _step2 =
    ADDCOLUMNS (
        _step1,
        "@EventCounter",
            CALCULATE (
                COUNT ( Sheet1[ref_no] ),
                DATESINPERIOD (
                    Sheet1[Date of Complaint],
                    MAX ( Sheet1[Date of Complaint] ),
                    -12,
                    MONTH
                )
            )
    ) // Calculate count of events rolling 12
VAR _step3 =
    FILTER ( _step2, [@Eventcounter] > 4 ) // retrieve employees with more than 4 events only
RETURN
    COUNTROWS ( _step3 )
//Count the number of rows of the filtered table
I also attach the pbix file to let you make some test.
12 month rolling is considered from the date where the last event happened (not from today).
Hope this can give the right result.
4 or more events Solution.pbix (75.9 KB)
Hi @Nicolo
I need to gather all employees with not only more than 4 but with 4 as well ( >=4)
I have changed the measure but it didn’t reflect in the table , please help.
Many thanks,
Iwona
4 or more events Solution.pbix (75.9 KB)
Hi @Iwona,
the fix you made in the formula is correct and it is correct it is not counting the employee you highlighted because the events occurred during the rolling 12 month are only 2.

Last event occured in 30/06/2022 so what is before june 2021 is not counted.
This is what i understood from your request.
Let me know if it is ok.
Nicolò
Hi @Nicolo,
You understood all perfectly. I like this measure without creating any additional tables.
I will implement your solution in my report.
Big thank you for you help and support.
Iwona