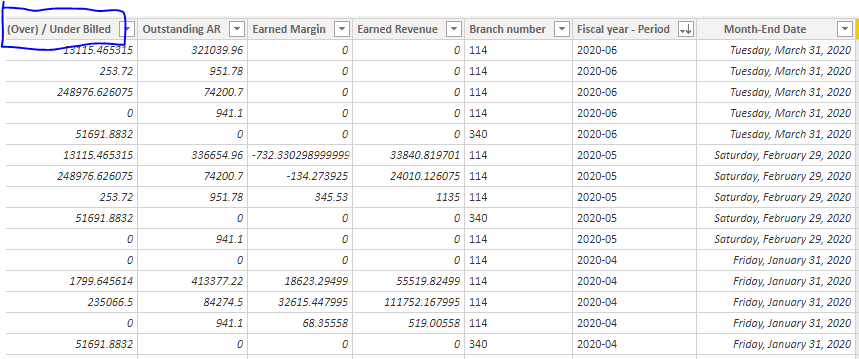
Hello, I am trying to figure out the best way to count the number of consecutive months that a measure had a negative or positive value. Specifically, with the dataset below, I want to count the number of consecutive months that total (over)/under billed column was over or under billed. Snip it 1 has the data set I’m working with. Snip it 2 has an example of how I would envision it working. Has anyone accomplished a similar task or thoughts on how to accomplish? Let me know if additional information is needed.
Thanks for posting your question @nickjordan32. To receive a resolution in a timely manner please make sure that you provide all the necessary details on this thread.
Here is a potential list of additional information to include in this thread; demo pbix file, images of the entire scenario you are dealing with, screenshot of the data model, details of how you want to visualize a result, and any other supporting links and details.
Including all of the above will likely enable a quick solution to your question.
As @Melissa suggested, PBI file will help us to test it better. However, if you let me know how did you calculate sample table for January/Feb values, I can give it a try after fully understanding your requirements.
Thanks for sending your dataset. Surely, it will be very helpful and hopefully quick for us to provide solution.
Can you please explain me logic based on your data set? How do you want to calculate total overbilled / # of month overbilled based on your provided data. If you give some example, we can take it from there and build DAX solution.
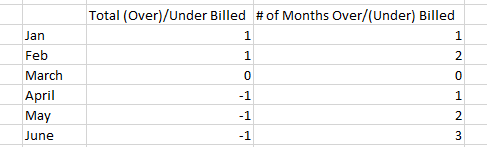
Hi Hafizsultan - I am trying to get the logic to count the number of consecutive months that the sum of (over) / under billed yields a postive value or a negative value. So if the sum of the column for March is 100, I want it to count 1. In April, if the sum of the April (over) / under billed is positive, I want it to count 2 as the sum of the column was positive for two consecutive months. Ideally, it would work the same way for negative values. So basically it is just counting the trend of each month’s value… Does that make sense?
Yes, that makes sense to me. I am a bit busy in some project and logic is little complicated but seems doable. I will be able to start work in couple of days on this if it remains open till then
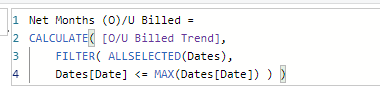
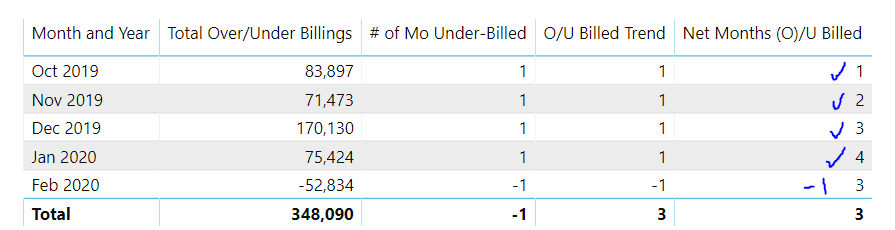
What I still need to figure out is how to get the net months (o)/U billed to change to -1 when the balances changes from negative to positive. See table above Feb 2020, instead of 3, I’m trying to produce - 1. Let me know your thoughts.
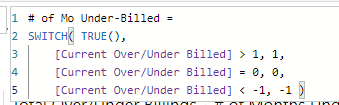
Thanks for sharing your steps. [Net Month (O) /U Billed] is calculating right based on your formula. It should check previous value and if it is different, then it should implement different logic. Like [O/U Billed Trend] is 1 is Jan & -1 in Feb, so it should implement different logic.
I personally feel that biggest challenge will be when value changes from +ve to -ve and back to +ve, then it will be tricky to count months.
As @Melissa suggested, if you can provide pbix file of your data that you have worked till now, it will be very helpful to test logic. It will help all of us to focus on same dataset and I am sure if I could not solve, @Melissa/@BrianJ will come to our rescue
Hi @nickjordan32, we’ve noticed that no response has been received from you since the 9th of March. We just want to check if you still need further help with this post? In case there won’t be any activity on it in the next few days, we’ll be tagging this post as Solved. If you have a follow question or concern related to this topic, please remove the Solution tag first by clicking the three dots beside Reply and then untick the checkbox. Thanks!
Hello, you guys can mark this as solved if you would like. I decided the measures in place sufficiently illustrate the meaningful trend, and I don’t think we need to explore any further.
This is a really interesting problem that I’ve been thinking about since you posted it initially, and think I finally cracked it. Had to throw a lot of DAX at it - here are the highlights:
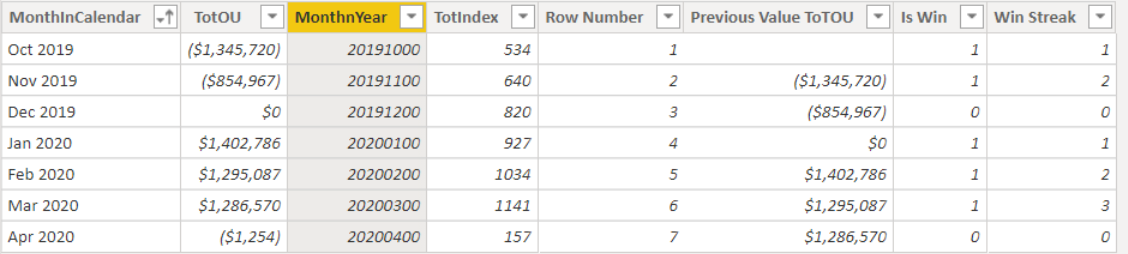
Used a series of table functions to create a physical table (pTable) summarizing the relevant fields and measures, where Total Over Under was not blank (but could be zero):
Created another calculated column using nested SWITCH( TRUE() ) functions to define a “win” (basically when Tot OU and previous Tot OU were the same sign, plus some other error trapping conditions):
P.S. Given that the entire solution was done via calculated columns, my sense is that this whole exercise is probably better done in Power Query, and I suspect @Melissa could do this in M with a fraction of the coding I did above in DAX. Also, shout out to Malagari on the Microsoft community forum for his conceptualization of the win streak logic behind the DAX calculation.
Please do let me know how it works for you. Conceptually, I think it’s a good solution, but I’m concerned about how it might perform on a really large data set, given how calculation intensive it is. Don’t know how big your model is, and whether that might be an issue or not, but if it is we may need to think about how to move some of the heavy lifting to Power Query to improve performance.