Hello @123kerrod,
Thank You for providing the mock-up file alongwith the results that you’re trying to achieve.
Well, this solution will require a combination of Power Query and DAX.
Let’s first move to the Power Query side -
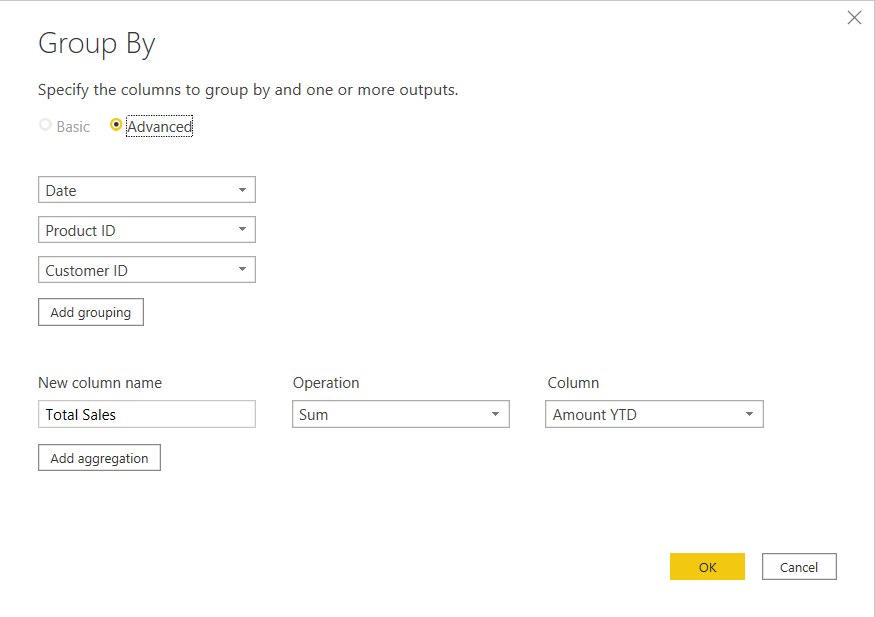
Since there are few multiple records for the same date against the Product ID and Customer ID such as for example Date = 30/09/2020, Product ID = 1 and Customer ID = 1. So firstly we’ll be required to “GROUP” the data. Below is the screenshot of the “Grouping” provided for the reference -
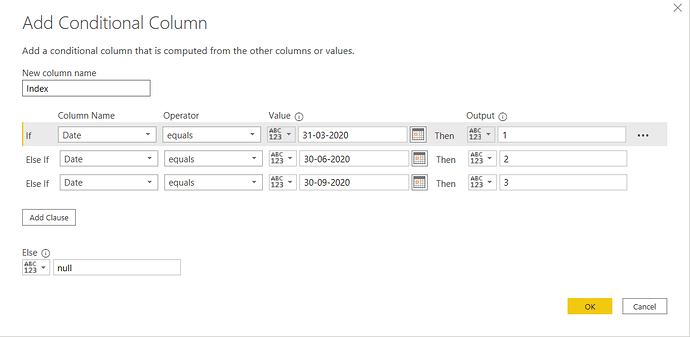
And now, once the data is grouped as per the above screenshot second step is to add the “Index” column based onto the “Date” field. Below is the screenshot provided for the reference -
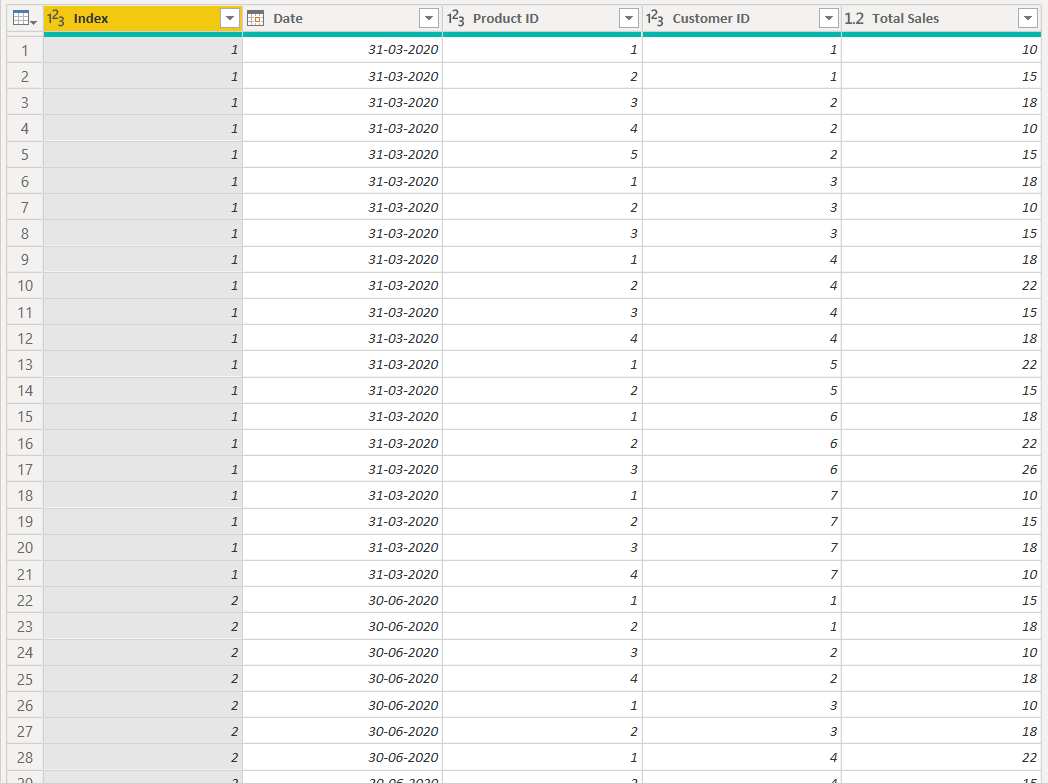
So before closing the Power Query the result will be like this. Below is the screenshot provided for the reference -
Now, once the data is loaded into the model. We’ll be required to create a “Calculated Column”. Below is the formula provided for the referemce -
SALES DIFFERENCE =
VAR myindex = 'Actual Data'[Index]

VAR mycustomer = 'Actual Data'[Customer ID]

VAR myproducts = 'Actual Data'[Product ID]

VAR previousindex =
    CALCULATE (
        MAX ( 'Actual Data'[Index] ) ,
            FILTER ( 'Actual Data' ,
                'Actual Data'[Customer ID] = mycustomer &&
                'Actual Data'[Product ID] = myproducts &&
                'Actual Data'[Index] < myindex )
    )
VAR previoussales =
    CALCULATE (
        MAX ( 'Actual Data'[Total Sales] ) ,
            FILTER (
                'Actual Data' ,
                'Actual Data'[Index] = previousindex &&
                'Actual Data'[Customer ID] = mycustomer &&
                'Actual Data'[Product ID] = myproducts
        )
    )
RETURN
    IF ( previoussales , 'Actual Data'[Total Sales] - previoussales )
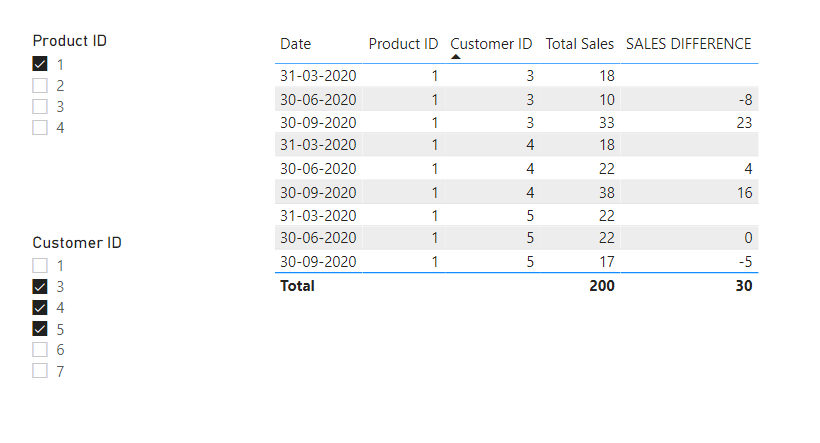
Now, once the calculated column is created you’ll be able to see the differential numbers based onto the quarters. Below is the screenshot provided for the reference -
I’m also attaching the working of the PBIX file for the reference.
Hoping you find this useful and meets your requirements that you’ve been looking for. 
Thanks and Warm Regards,
Harsh
Quarter-On-Quarter Calculation.pbix (95.1 KB)


